The ability to monitor your Sitecore instances is essential. Knowing your application is available and performing in production as expected is critical. To be proactive and respond to changes in performance as opposed to reactive after an incident has occurred, you need a continuous overview of the state of the application and the underlying infrastructure. This involves gathering metrics like CPU, memory usage, and storage consumption as well as any application-related metrics. However, when monitoring a containerized Sitecore instance we cannot apply our usual methods and tools to provide us with all the data we need. In this post, I will show you some of the native tools to help you monitor Sitecore containers.
Docker stats
The docker stats command display a live stream (updated every second) of running containers resource usage statistics docker stats:

- CPU % – the percentage of the host’s CPU the container is using.
- PRIV WORKING SET – refers to the total physical memory (RAM) used by the process.
- NET I/O – the amount of data the container has sent and received over its network interface.
- BLOCK I/O – the amount of data the container has read to and written from block devices on the host.
By default, the stats for all running containers are displayed you can exit gracefully using CTRL+C. If you want just a snapshot of the stats you can use –no-stream flag. You can also use the –format flag which I mentioned in a previous post. If you just want stats for specific containers then specify the container Ids.
PS> docker stats –no-stream –format “table {{ .Container}}\t{{.CPUPerc}}\t{{.MemUsage}}” 5dca4817d1fe 7416667d5f06

As you can see the docker stats command is useful if you want to quickly check how your containers are performing at any given moment. But this data is not stored so we cannot monitor the data over a period of time without introducing other tools to capture and store the results.
Docker API
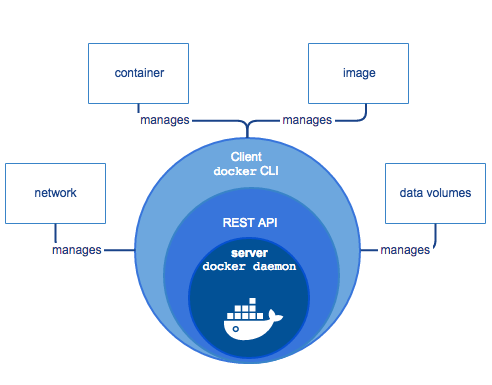
The Docker daemon provides a REST API used to communicate with docker directly, it’s what Docker CLI and other tools use to communicate the daemon.
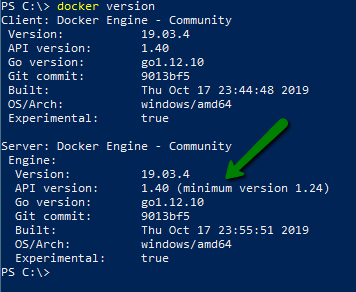
The API is backward compatible so there are different versions available, to see which version you have installed run the docker version command.
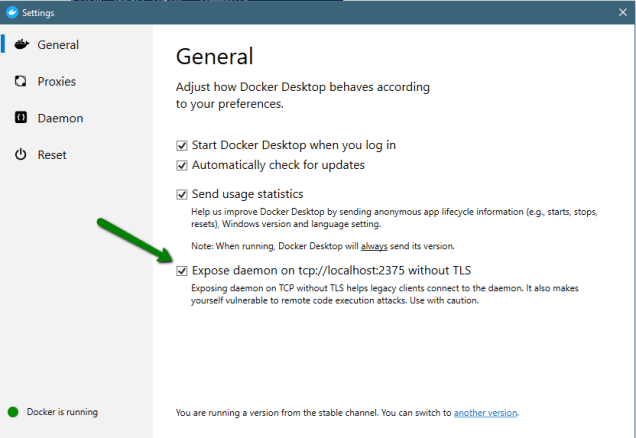
Check out the API documentation as it is really helpful, you can access it via the following URL https://docs.docker.com/engine/api/latest/ (or specify your specific version). Before you can call the API methods, you need to enable docker to receive remote TCP requests. This can be achieved either via the general tab in settings if you are running docker desktop or by modifying the docker daemon config manually.
WARNING: As it states in the description you are making yourself vulnerable and open to the possibility of attacks. You can secure the Docker Daemon to use client certificate authentication via a TLS cert. I won’t cover that here but recommend you take a look at the following:
- Protect the Docker daemon socket by Docker
- Protect the Docker daemon socket on Windows by Microsoft
- How to protect a Windows 2016 Docker engine with TLS by Stefan Scherer
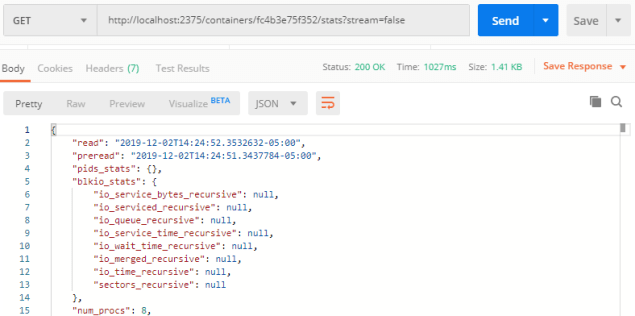
Once enabled you can hit the API using client tools like Postman or Fiddler. Here is an example using Postman calling the stats command for a single container with the stream param set to false (to grab a snapshot) and the complete JSON response is shown below.
| { | |
| "read": "2019-12-02T14:24:52.3532632-05:00", | |
| "preread": "2019-12-02T14:24:51.3437784-05:00", | |
| "pids_stats": {}, | |
| "blkio_stats": { | |
| "io_service_bytes_recursive": null, | |
| "io_serviced_recursive": null, | |
| "io_queue_recursive": null, | |
| "io_service_time_recursive": null, | |
| "io_wait_time_recursive": null, | |
| "io_merged_recursive": null, | |
| "io_time_recursive": null, | |
| "sectors_recursive": null | |
| }, | |
| "num_procs": 8, | |
| "storage_stats": { | |
| "read_count_normalized": 15445, | |
| "read_size_bytes": 124240896, | |
| "write_count_normalized": 88377, | |
| "write_size_bytes": 685403136 | |
| }, | |
| "cpu_stats": { | |
| "cpu_usage": { | |
| "total_usage": 29241090088, | |
| "usage_in_kernelmode": 0, | |
| "usage_in_usermode": 0 | |
| }, | |
| "throttling_data": { | |
| "periods": 0, | |
| "throttled_periods": 0, | |
| "throttled_time": 0 | |
| } | |
| }, | |
| "precpu_stats": { | |
| "cpu_usage": { | |
| "total_usage": 29238502773, | |
| "usage_in_kernelmode": 0, | |
| "usage_in_usermode": 0 | |
| }, | |
| "throttling_data": { | |
| "periods": 0, | |
| "throttled_periods": 0, | |
| "throttled_time": 0 | |
| } | |
| }, | |
| "memory_stats": { | |
| "commitbytes": 1086763008, | |
| "commitpeakbytes": 1089073152, | |
| "privateworkingset": 331587584 | |
| }, | |
| "name": "/habitathome_cm_1", | |
| "id": "fc4b3e75f352408f93712f69cf91088227988cda668f77ad326e8b00ab8615bc", | |
| "networks": { | |
| "44BEB9D1-F931-42A3-9E98-3560565065A8": { | |
| "rx_bytes": 1978555, | |
| "rx_packets": 9167, | |
| "rx_errors": 0, | |
| "rx_dropped": 3492, | |
| "tx_bytes": 481888, | |
| "tx_packets": 1068, | |
| "tx_errors": 0, | |
| "tx_dropped": 0 | |
| } | |
| } | |
| } |
As you can see the API stats method provides a lot more details compared to the CLI stats command. However, if you are running several containers at scale in production you are going to require tools that are capable of gathering metrics from your containers, monitoring and alerting you when there is a potential issue. In my next post, I’ll go into some of the popular tools like Prometheus and Grafana.
Healthz
Thanks to the contributions of Per Manniche Bering who created the Sitecore Health Extensions. Healthz is a Sitecore Health Check service and is included in Sitecore 9.3. It provides two endpoints allowing you to check the health of your instance:
- <instance>/healthz/live – returns 200 OK to indicate that the application is running otherwise 50x if Sitecore is not able to initialize.
- <instance>/healthz/ready – returns 200 OK to indicate that the application is ready to accept requests otherwise 503 if connections to SQL, Solr etc. are not responsive.
In the example below I have a Sitecore 9.3 XM and the CM, SQL and Solr Containers are running if I run:
PS> Invoke-WebRequest -Uri “http://sitecoredevlocal_cm_1/healthz/ready”
It returns 200 great everything is healthy. But if I stop the Solr container and rerun the web request I get a 503 error.
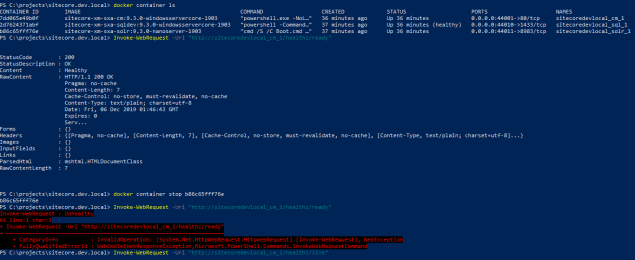
This is extremely useful in production for determining the health of individual containers when you are running them in a cluster.
Docker Logs
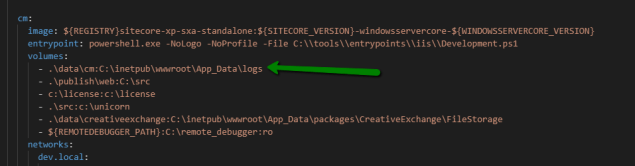
You can still get access Sitecore, IIS, Solr and SQL logs through docker volume mounts which you can specify in your docker-compose file. Allowing you to run the normal tools you use to consume and analyze Sitecore logs like SCLA. But its not really the docker way.
If you run a container in interactive mode or you attach to a container you will see a stream of logs written to the console window. Docker outputs anything written to the stdout or stderr streams by the processes running within the container. But most of the time we run containers –detached so you don’t see these logs. Yes, you could attach to a container and view any current logs being written but that won’t help you troubleshoot issues that have already occurred or what if the container has stopped?
Thankfully with the Docker API and CLI you can run the logs command which allows you to view container logs even after the container has stopped.
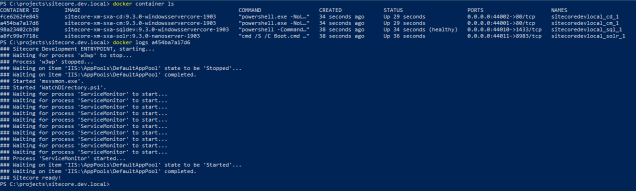
PS> docker logs <container id/name> – view all logs for a container. In the example below I’ve just started a local Sitecore 9.3 XM and ran the docker log command against the CM instance. You can see the initial stdout from the development.ps1 ENTRYPOINT script :
PS> docker logs –follow <container id/name> – view the logs of a Docker container in real time. This is useful to have open in another window when you are developing in Sitecore for troubleshooting an issue. As it provides a stream of logs as you interact with Sitecore.
PS> docker logs –tail 2500 <container id/name> – view the last n lines of the logs.
PS> docker logs –timestamps <container id/name> – view logs since particular date or timestamp.
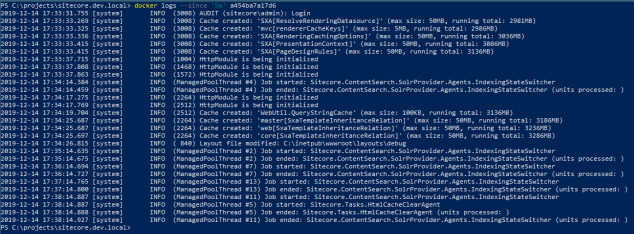
PS> docker logs –since 2019-12-13 <container id/name> – view logs from a specific date and/or time, for example, you could even specify to see the logs for the last 5 minutes:
You can even view the logs for all the containers in your compose file if you have started your application in detached mode by running:
PS> docker-compose logs
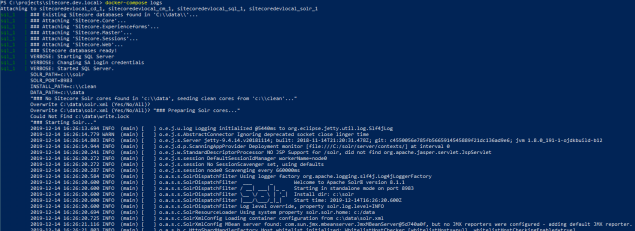
You can also use the following options with docker-compose logs: –follow, –timestamp and –tail.
The docker logs feature is made possible by the docker log driver which receives the log stream from the container and processes it. The log driver is configured in the daemon.json however you can configure a containers log driver to have a different log driver or change the default in daemon.json for all containers. There are several different log drivers supported:
- json-file – logs are formatted as JSON. This is the default logging driver for Docker.
- syslog – writes logging messages to the syslog facility. The syslog daemon must be running on the host machine.
- journald – writes log messages to journald. The journald daemon must be running on the host machine.
- gelf – writes log messages to a GELF endpoint such as Graylog or Logstash.
- fluentd – writes log messages to fluentd. The fluentd daemon must be running on the host machine.
- awslogs – writes log messages to Amazon CloudWatch Logs.
- splunk – writes log messages to Splunk using the HTTP Event Collector.
- etwlogs – writes log messages as Event Tracing for Windows (ETW) events.
- gcplogs – writes log messages to Google Cloud Platform (GCP) Logging.
- logentries – writes log messages to Rapid7 Logentries.
To check the current logging driver for docker run:
PS> docker info –format ‘{{.LoggingDriver}}’
Use the container inspect command if you want to check the driver for a container:
PS> docker inspect –format ‘{{.HostConfig.LogConfig.Type}}’ <container id/name>
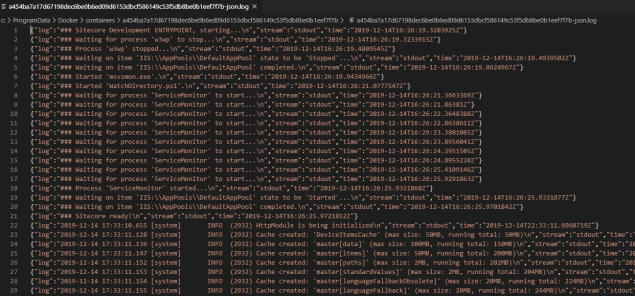
To view the default json log file for a container grab the log path using the inspect command:
PS> docker container inspect –format ‘{{ .LogPath }}’ <container id/name>

Here is a sample json-file log:
To be able to monitor, search and analyze your container logs at scale in production you are going to need a suitable log management platform like the ELK stack or Splunk. Using the log drivers and plugins available for docker makes it possible for you to scrape or write logs to these various management platforms.
Additional Info
- Docker stats command
- Develop with Docker Engine SDKs and API
- .NET Client for Docker Remote API
- Docker logs command
- JSON File Logging Driver

Great walkthrough. I often use the docker-compose specific commands, eg. to see logs from a service called “cm” defined in my docker-compose.yml file and follow it (keep it open), I can run “docker-compose logs –follow cm”
LikeLiked by 1 person