Standing up an instance of Sitecore 10.2 on docker is pretty straightforward. The Sitecore team has done an excellent job of covering all the detailed steps required, which if you’ve never stood up an instance of Sitecore running on containers in your local instance is really useful. If that’s you then you should consider reading the developers install guide, otherwise, if you just want a quick guide, continue on.
Continue readingDocker
How to back up and restore a Docker Image
There are occasions when you want to take a snapshot of your existing local docker images, for example, you might have a running version locally and there is a newer version you want to test and then easily revert back to your current running version. Running a docker compose pull will update your existing image. Remember to include any prefix and version postfix.
docker save image-name:{version} > c:/backup/image-name.tar
If you backed up your images to a local tar file, to restore previously saved images run:
docker image load -i c:/backup/image-name.tar
Useful Links
Instrument Sitecore SQL Container for Prometheus
In the previous post in this series on monitoring Sitecore containers I showed you how to instrument your Solr container, in this post, I’ll show you how to instrument the Sitecore SQL container and expose metrics for Prometheus to scrape.
SQL Exporters
There are several SQL exporters available in the Prometheus community some of these are SQL agnostic. Those that support MSSQL, either obtain their metrics via performance counters or by querying SQL directly. I recommend you review the different exporters and then choose an exporter that meets your specific requirements or you create your own custom exporter.

Lets take a look some of these exporters and see if they would be a good fit for exporting metrics from Sitecore SQL container.
Continue readingPrometheus File Based Service Discovery
One of the challenges with having a pull model like Prometheus is that it needs to know where the targets are located so it can scrape the metrics. While we can configure static scrape targets in the Prometheus configuration file directly for our local environment I discovered anytime I want to make changes to these setting or add a new target I must restart Prometheus. This can be very annoying, as compared to my Sitecore containers, the Prometheus container takes much longer to stop and restart. So I needed to find a better solution for configuring these targets locally.
Service Discovery
Service Discovery helps solve the problem of identifying scrape targets which is really useful in an orchestrated environment as it will dynamically discover targets. There is support for several common services like:
There are several other methods of Service Discovery supported by Prometheus:
<dockerswarm_sd_config>(scrape targets from docker swarm)- <azure_sd_config> (scrape targets from Azure VMs)
- <sc2_sd_config> (scrape targets from AWS EC2 instances)
- <kuberenetes_sd_config> (scrape targets from kubernetes)
Tips for working with Coveo For Sitecore in Docker
In the previous post I shared how you create Coveo for Sitecore variant docker images. In this post i’ll share some tips when running Coveo for Sitecore in a Container how to configure and persist your trial organization details.

Build Coveo for Sitecore Docker image variants
I’ve been developing with Sitecore on Docker for almost a year now… WOW time flies when you are having fun! While the Sitecore Docker image repo is awesome and provides a range of Sitecore variants, you will probably discover the need for additional image variants, depending on your project. As you often require additional modules to be installed as your base Sitecore install, like the Coveo for Sitecore module! Rather than your team having to install this module manually when they docker compose up, it would much quicker and easier they have a variant image they can use with it already installed. In this post, I will show you how to can build a docker image variant for Coveo for Sitecore v5 using the Sitecore 9.3 images.
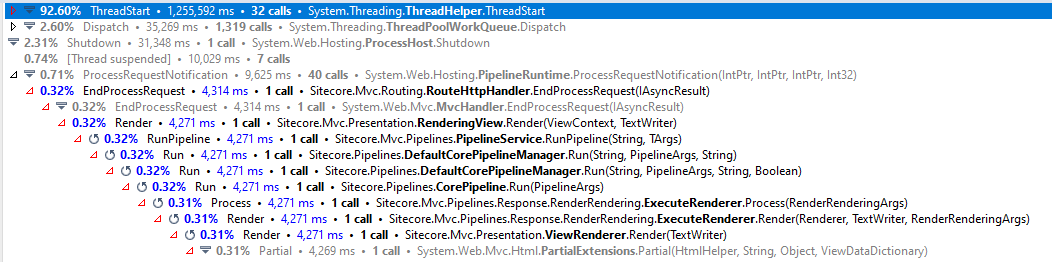
How to Profile Containerized Sitecore instance with dotTrace
Performance tools, like dotTrace profiler are really useful when trying identify potential bottlenecks in your Sitecore application. Normally, attaching to the w3wp.exe process and profiling your local Sitecore instance is relatively straightforward, however now that we are taking advantage of Docker and running our instances in containers the process is slightly different. In this post I’ll show you how to profile your Sitecore instance running in containers.
Monitoring Sitecore Container environment Host OS and Docker
In part 1 of this series, I introduced Prometheus and lay some foundations for monitoring a Sitecore container environment using Prometheus. In this post, I will show you how to collect and monitor the Host OS and container metrics exposed by Docker.
Why should we care about Docker the Host OS Metrics?
To monitor your containerized Sitecore application effectively you need to understand the health of the underlying system your containers are running on. To achieve this, you have to monitor the system metrics like CPU, memory, network, and disk also docker is starting and stopping containers so you need to know the state of your docker resource.
How to collect Docker performance metrics
Docker supports Prometheus OOTB and provides performance metrics you can collect and monitor, however it is disabled by default.
1. Enabling Docker Metrics.
First things first lets enable the metrics. Open the daemon.json file and add the metrics-address setting:
“metrics-addr” : “127:0:0:1:9323”
Apply and restart docker. Now you should be able browse to the docker metrics 127.0.0.1:9323/metrics and verify metrics are exposed.

Monitoring Sitecore Container environment with Prometheus
In a previous post I provided you with some techniques to help you monitor your Containerized Sitecore instance using native tools. Over the next few posts, I will show some of the common tools and techniques used for monitoring applications running in containers. When I initially started thinking about this I considered using InfluxDB as my time series DB to store the performance metrics and Grafana for visualizing and alerting. As both of these were already in my tool-set for load testing. However, the more I dug into monitoring container performance I quickly realized, Prometheus has established itself as the leading tool in this space and Docker also provides support for Prometheus – more on that later. So let’s start with an introduction to Prometheus and lay some foundations for a monitoring platform.
What is Prometheus?
Prometheus is an open-source application for monitoring systems and generating alerts. It can monitor almost anything, from servers to applications, databases, or even a single process. Prometheus monitors your defined targets by scraping metric data in a simple text format that is exposed by the target. Prometheus stores this metric data in a multi-dimensional data model by metric name and key/value in its timeseries database which can then be queried and retrieved using its own query language PromQL, in a nutshell.
Let’s take a quick look at the the main components and architecture that comprise of the Prometheus platform.

Querying your Sitecore SQL container
Occasionally you may need to connect to the Sitecore SQL instance and inspect the databases when running in docker. This is relatively straightforward.
Using SQL Manager
1. Identify the IP address of your SQL Instance
PS> docker inspect container [options] <container id/name>

NOTE: IP address changes every time you run docker-compose up.
If you are not sure of the name of your container name or id you can use the following command to get list of running containers
PS> docker container ls Continue reading
