In the previous post in this series on monitoring Sitecore containers I showed you how to instrument your Solr container, in this post, I’ll show you how to instrument the Sitecore SQL container and expose metrics for Prometheus to scrape.
SQL Exporters
There are several SQL exporters available in the Prometheus community some of these are SQL agnostic. Those that support MSSQL, either obtain their metrics via performance counters or by querying SQL directly. I recommend you review the different exporters and then choose an exporter that meets your specific requirements or you create your own custom exporter.

Lets take a look some of these exporters and see if they would be a good fit for exporting metrics from Sitecore SQL container.
WMI exporter (windows exporter) – I demonstrated how this can be used for monitoring your Windows HostOS. This exporter also includes a MSSQL collector to expose a range of SQL performance objects. A complete list of those metrics can be found here. However, I think I prefer the idea of being able to configure a small subset performance metrics obtained by querying SQL directly.
SQL-Exporter – is a database agnostic SQL exporter written in go. It started off as a MS SQL Server exporter but has since evolved to include PostgreSQL, MySQL and Clickhouse support. It is configuration driven meaning the collected metrics and their queries can be entirely defined by configuration. It is also available as an executable or as a docker image.
Prometheus-mssql-exporter – is a node.js exporter and is also available as a docker image. The concept is similar to SQL-Exporter with a set of SQL queries that are defined in the metrics.js file exposing sql results as a label and a value in the Prometheus format.
While considering creating a custom .net exporter I stumbled upon MSSQL Exporter for Prometheus. Written in .net this exporter also allows you to specify metrics in a configurable metrics.json file or within the docker compose file. The connection string is set via an environment variable making it easy to configure.
Running the MSSQL Exporter
You can run the SQL Exporter from a separate container within your stack. This is known as side-car container – a container to help monitor an application container.

To run it as a separate container you would need to either modify your existing Sitecore docker compose file. Alternatively, you could take advantage of the docker-compose feature to extend your container stack using multiple compose files with the SQL exporter defined in separate compose file. Alternatively, you could copy the exporter to your SQL container using a mapped volume mount and then simply start the exporter.
Configuring the Exporter
To configure the SQL exporter you need to define the details to establish a connection to SQL instance and define the metric collector queries.
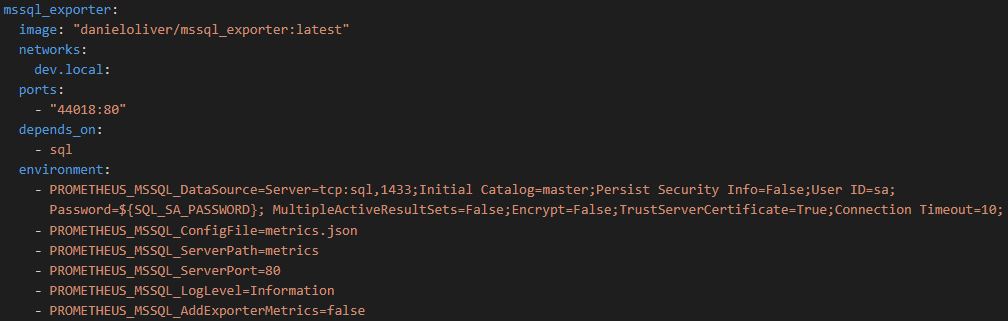
As you can see I have opted to define the queries in a separate metrics.json file you can also specify them in the compose file itself by setting the PROMETHEUS_MSSQL_ConfigText variable.
Defining the metric collector queries is pretty self explanatory here is an example metric.json:
 {
    "Queries": [
        {
            "Name": "mssql_deadlocks",
            "Query": "SELECT cntr_value FROM sys.dm_os_performance_counters where counter_name = 'Number of Deadlocks/sec' AND instance_name = '_Total'",
            "Description": "Number of lock requests per second that resulted in a deadlock since last restart",
            "Columns": [
                {
                    "Name": "cntr_value",
                    "Label": "mssql_deadlocks",
                    "Usage": "Gauge",
                    "DefaultValue": 0
                }
            ]
        },
        {
            "Name": "mssql_physicalmemory",
            "Query": "SELECT cntr_value FROM sys.dm_os_performance_counters where counter_name = 'Total Server Memory (KB)'",
            "Description": "Total amount of physical memory on the Server",
            "Columns": [
                {
                    "Name": "cntr_value",
                    "Label": "mssql_physicalmemory",
                    "Usage": "Gauge",
                    "DefaultValue": 0
                }
            ]
        },
        {
            "Name": "mssql_sitecore_eventqueuecore",
            "Query": "SELECT COUNT(*) as cntr_value FROM [Sitecore.Core].[dbo].[EventQueue]",
            "Description": "Sitecore Core EventQueue",
            "Columns": [
                {
                    "Name": "cntr_value",
                    "Label": "mssql_sitecore_eventqueuecore",
                    "Usage": "Gauge",
                    "DefaultValue": 0
                }
            ]
        },
        {
            "Name": "mssql_sitecore_eventqueuemaster",
            "Query": "SELECT COUNT(*) as cntr_value FROM [Sitecore.Master].[dbo].[EventQueue]",
            "Description": "Sitecore Master EventQueue",
            "Columns": [
                {
                    "Name": "cntr_value",
                    "Label": "mssql_sitecore_eventqueuemaster",
                    "Usage": "Gauge",
                    "DefaultValue": 0
                }
            ]
        }
 ],
    "MillisecondTimeout": 4000
}
AS you can see you name the metric, define the query, add a description and map the values returned in the query to columns.
Configure Prometheus
Once the exporter is running you just need to configure Prometheus to scrape the SQL target.
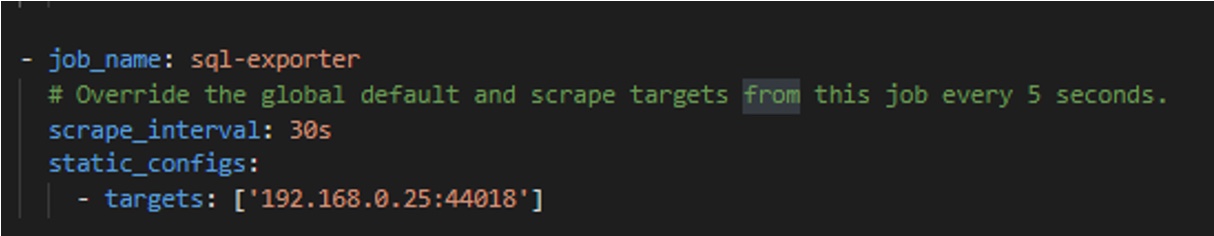
Then verify the target is being scraped and there are no issues.

Grafana Dashboard
Once you have your metrics in Prometheus now all you need is to build out your grafana dashboard. There are a few examples of SQL performance metric dashboards already available in the Grafana gallery that work with these existing exporters you could grab one of these as your starting point and modifying to suite your custom queries or create a new dashboard.
Conclusion
While there are different exporter options available, I prefer idea of being able to configure a small subset performance metrics, obtained by querying SQL directly. This has the advantage of being able to obtain SQL performance metrics as well as Sitecore specific queries. Like checking the EventQueue, PublishQueue or even the publishing operations if you are running say the Publishing Service. Monitoring these table could help you ensure cleanup agents are configured and tuned appropriately.
The ability to configure any SQL query and point it at your Sitecore databases and have that exposed as a metric to be consumed by Prometheus for monitoring provides lots of flexibility, however with great power comes great responsibility. You could easily add extra pressure to your SQL container with expensive queries running too frequently collecting metrics. So be mindful of the queries and the frequency in which you configure them to be scraped by Prometheus.
Useful Info
- Prometheus exporters & integrations
- WMI Exporter MSSQL
- Prometheus SQL Exporter
- Prometheus MSSQL Exporter
- MSSQL Exporter for Prometheus
Have fun!!
