In part 1 of this series, I introduced Prometheus and lay some foundations for monitoring a Sitecore container environment using Prometheus. In this post, I will show you how to collect and monitor the Host OS and container metrics exposed by Docker.
Why should we care about Docker the Host OS Metrics?
To monitor your containerized Sitecore application effectively you need to understand the health of the underlying system your containers are running on. To achieve this, you have to monitor the system metrics like CPU, memory, network, and disk also docker is starting and stopping containers so you need to know the state of your docker resource.
How to collect Docker performance metrics
Docker supports Prometheus OOTB and provides performance metrics you can collect and monitor, however it is disabled by default.
1. Enabling Docker Metrics.
First things first lets enable the metrics. Open the daemon.json file and add the metrics-address setting:
“metrics-addr” : “127:0:0:1:9323”
Apply and restart docker. Now you should be able browse to the docker metrics 127.0.0.1:9323/metrics and verify metrics are exposed.

2. Configure Docker Target
Update the Prometheus configuration file and add Docker as a new target.
| - job_name: docker | |
| honor_timestamps: true | |
| scrape_interval: 30s | |
| scrape_timeout: 20s | |
| metrics_path: /metrics | |
| scheme: http | |
| static_configs: | |
| - targets: | |
| - 192.168.0.25:9323 |
3. Verify Docker Target in Prometheus
Run docker-compose up -d and check the Prometheus targets and configuration and PromQL.

What metrics does docker expose?
Here is a list of metrics exposed by docker:
| Metric | Description | Type |
|---|---|---|
| builder_builds_failed_total | Number of failed image builds. | counter |
| builder_builds_triggered_total | Number of triggered image builds. | counter |
| engine_daemon_container_actions_seconds | The number of seconds it takes to process each container action. | histogram |
| engine_daemon_container_states_containers | The count of containers in various states. | gauge |
| engine_daemon_engine_cpus_cpus | The number of cpus that the host system of the engine has. | gauge |
| engine_daemon_engine_info | The information related to the engine and the OS it is running on. | gauge |
| engine_daemon_engine_memory_bytes | The number of bytes of memory that the host system of the engine has. | gauge |
| engine_daemon_events_subscribers_total | The number of current subscribers to events. | gauge |
| engine_daemon_events_total | The number of events logged. | counter |
| engine_daemon_health_checks_failed_total | The total number of failed health checks. | counter |
| engine_daemon_health_checks_total | The total number of health checks. | counter |
| etcd_debugging_snap_save_marshalling_duration_seconds | The marshalling cost distributions of save called by snapshot. | histogram |
| etcd_debugging_snap_save_total_duration_seconds | The total latency distributions of save called by snapshot. | histogram |
| etcd_disk_wal_fsync_duration_seconds | The latency distributions of fsync called by wal. | histogram |
| etcd_snap_db_fsync_duration_seconds | The latency distributions of fsyncing .snap.db file. | histogram |
| etcd_snap_db_save_total_duration_seconds | The total latency distributions of v3 snapshot save. | histogram |
| go_gc_duration_seconds | A summary of the GC invocation durations. | summary |
| go_goroutines | Number of goroutines that currently exist. | gauge |
| go_memstats_alloc_bytes | Number of bytes allocated and still in use. | gauge |
| go_memstats_alloc_bytes_total | Total number of bytes allocated, even if freed. | counter |
| go_memstats_buck_hash_sys_bytes | Number of bytes used by the profiling bucket hash table. | gauge |
| go_memstats_frees_total | Total number of frees. | counter |
| go_memstats_gc_sys_bytes | Number of bytes used for garbage collection system metadata. | gauge |
| go_memstats_heap_alloc_bytes | Number of heap bytes allocated and still in use. | gauge |
| go_memstats_heap_idle_bytes | Number of heap bytes waiting to be used. | gauge |
| go_memstats_heap_inuse_bytes | Number of heap bytes that are in use. | gauge |
| go_memstats_heap_objects | Number of allocated objects. | gauge |
| go_memstats_heap_released_bytes_total | Total number of heap bytes released to OS. | counter |
| go_memstats_heap_sys_bytes | Number of heap bytes obtained from system. | gauge |
| go_memstats_last_gc_time_seconds | Number of seconds since 1970 of last garbage collection. | gauge |
| go_memstats_lookups_total | Total number of pointer lookups. | counter |
| go_memstats_mallocs_total | Total number of mallocs. | counter |
| go_memstats_mcache_inuse_bytes | Number of bytes in use by mcache structures. | gauge |
| go_memstats_mcache_sys_bytes | Number of bytes used for mcache structures obtained from system. | gauge |
| go_memstats_mspan_inuse_bytes | Number of bytes in use by mspan structures. | gauge |
| go_memstats_mspan_sys_bytes | Number of bytes used for mspan structures obtained from system. | gauge |
| go_memstats_next_gc_bytes | Number of heap bytes when next garbage collection will take place. | gauge |
| go_memstats_other_sys_bytes | Number of bytes used for other system allocations. | gauge |
| go_memstats_stack_inuse_bytes. | Number of bytes in use by the stack allocator. | gauge |
| go_memstats_stack_sys_bytes | Number of bytes obtained from system for stack allocator. | gauge |
| go_memstats_sys_bytes | Number of bytes obtained by system. Sum of all system allocations. | gauge |
| http_request_duration_microseconds | The HTTP request latencies in microseconds. | summary |
| http_request_size_bytes | The HTTP request sizes in bytes. | summary |
| http_response_size_bytes | The HTTP response sizes in bytes | summary |
| logger_log_entries_size_greater_than_buffer_total | Number of log entries which are larger than the log buffer | counter |
| logger_log_read_operations_failed_total | Number of log reads from container stdio that failed. | counter |
| logger_log_write_operations_failed_total | Number of log write operations that failed. | counter |
| swarm_dispatcher_scheduling_delay_seconds | Scheduling delay is the time a task takes to go from NEW to RUNNING state. | histogram |
| swarm_manager_configs_total | The number of configs in the cluster object store. | gauge |
| swarm_manager_leader | Indicates if this manager node is a leader. | gauge |
| swarm_manager_networks_total | The number of networks in the cluster object store | gauge |
| swarm_manager_nodes | The number of nodes. | gauge |
| swarm_manager_secrets_total | The number of secrets in the cluster object store. | gauge |
| swarm_manager_services_total | The number of services in the cluster object store. | gauge |
| swarm_manager_tasks_total | The number of tasks in the cluster object store. | gauge |
| swarm_node_manager | Whether this node is a manager or not. | gauge |
| swarm_raft_snapshot_latency_seconds | Raft snapshot create latency. | histogram |
| swarm_raft_transaction_latency_seconds | Raft transaction latency. | histogram |
| swarm_store_batch_latency_seconds | Raft store batch latency. | histogram |
| swarm_store_lookup_latency_seconds | Raft store read latency. | histogram |
| swarm_store_memory_store_lock_duration_seconds | Duration for which the raft memory store lock was held. | histogram |
| swarm_store_read_tx_latency_seconds | Raft store read tx latency. | histogram |
| swarm_store_write_tx_latency_seconds | Raft store write tx latency. | histogram |
Collect Host OS Performance Metrics
To be able to get our Host metrics into Prometheus we need a service that is capable of exposing them in the Prometheus format this is known as an Exporter. If I was running on Linux or a MAC I would use the popular Node Exporter. However, as I am on Windows I need to use WMI Exporter. WMI Exporter is capable of exposing Metrics like CPU Usage, Memory, Disk I/O as well as IIS, and SQL.
1. Install WMI Exporter
To install the WMI exporter, head over to the WMI releases page on GitHub or use chocolatey:
choco install prometheus-wmi-exporter.install
2. Verify Host OS Metrics
WMI runs as a webservice “WMI Exporter” Once installed I can now browse to http://localhost:9182/Metrics

3. Configure HostOS Target
Now I can update our Prometheus Config to include a job to target the HostOS
| - job_name: hostos | |
| honor_timestamps: true | |
| scrape_interval: 30s | |
| scrape_timeout: 20s | |
| metrics_path: /metrics | |
| scheme: http | |
| static_configs: | |
| - targets: | |
| - 192.168.0.25:9182 |
4. Verify HostOS Target in Prometheus
Run docker-compose up -d and check the Prometheus targets and configuration and PromQL.

I’ll can verify the metrics are being captured by Prometheus:

5. Grafana Dashboard for Host Metrics
While you could also create your own HostOS Grafana dashboard there are some excellent WMI Exporter dashboards available in the Grafana gallery. Simply search for WMI exporter, once you’ve located an existing dashboard you would like to use you can import it into your instance. In my case I have chosen the Windows Host Metrics Base
To import a dashboard from the Manage Dashboards screen click Import dashboard.

Enter your selected Grafana dashboard Id, alternatively you can paste the dashboard json, if you copied or saved it locally, and click load. Verify the dashboard details you are about to import. Here you can change the name of the dashboard, folder, identifier and data source you will need to select Prometheus.

Click Import and you should see the WMI Exporter dashboard display metrics about your local HostOS.
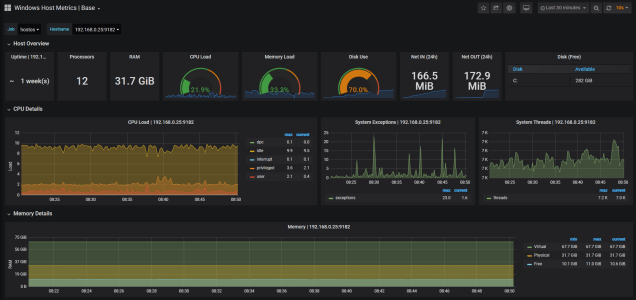
As you can see this dashboard provides extensive metrics about your HostOS.
The Overview panels provides a glimpse of the overall status of the Host:
- Uptime
- Processors
- RAM
- CPU Load
- Memory Load
- Disk usage
- Network In/Out
- Disk space
The CPU Panels displays load on the CPU the total thread consumed, which is great if you are experience issues cause by thread starvation you set an alert on these metrics, and the number of system exceptions dispatched.

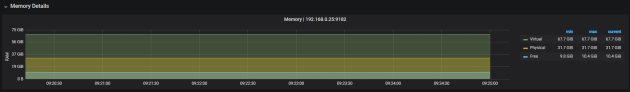
Ability to monitor memory and set alerts based on high memory consumption is critical. The memory panel allows you to monitor virtual physical and memory available.
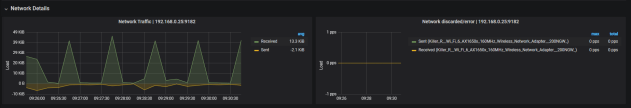
The network details panel provides insight into the network usage. Allowing you to check the number of packets sent versus the packets received.
Finally the Disk details panels provide information on the physical disk usage, activity and IO.

