How to Profile Containerized Sitecore instance with dotTrace

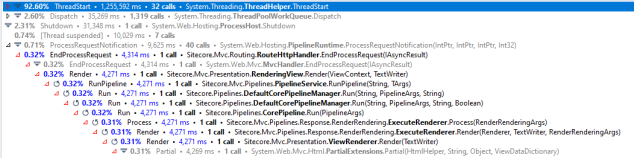
Performance tools, like dotTrace profiler are really useful when trying identify potential bottlenecks in your Sitecore application. Normally, attaching to the w3wp.exe process and profiling your local Sitecore instance is relatively straightforward, however now that we are taking advantage of Docker and running our instances in containers the process is  slightly different. In this post I’ll show you how to profile your Sitecore instance running in containers.

dotTraceProfiling

Continue reading

Handy dandy tool for sharing Sitecore instances

Often while working on projects, a team member may ask you to share your local Sitecore instance with them. Or you might even want to expose your local site to an external service for performance testing/analysis. There is a handy dandy tool that makes this really easy, ngrok. Using secure tunnels ngrok exposes local sites behind NATs and firewalls to the public internet. By connecting to the ngrok cloud service which accepts traffic on a public address and relays that traffic through to the ngrok process running on your machine and then on to the local address you specify.

There are various plans available including a free plan which supports:

  • HTTP/TCP tunnels on random URLs/ports
  • 1 online ngrok process
  • 4 tunnels/ngrok process
  • 40 connections / minute

localsitecore

Continue reading

Load Testing with JMeter Advanced

In my previous post in this series on load testing I provided an introduction to JMeter to help get you started in this post I’ll explore the following topics and provide solutions to some challenges you may come across while creating your load tests.

Continue reading

Load Testing made easy with JMeter

In my previous post, I looked at the importance of load testing. In this next post in this series on load testing, I will show you how to use JMeter to create a simple load test, take a look at the various JMeter’s components and some features you should familiarize yourself with to help make load testing easy.

  • JMeter is a Java application as a pre-requisite you will need to install the latest 64bit JDK or JRE.
  • Download the latest binaries and unzip to a directory, for example, c:\jmeter.
  • To run navigate to the \bin directory and run Jmeter.bat or if you are on a mac jmeter.sh.

JMeter UI overview

The UI is divided into three main functional areas:

  1. Menu bar – provides access to a lot of the main functions and provides relevant information to current running tests.
  2. Left panel – contains a hierarchical tree view of one or more test plans and the various components contained in the plans.
  3. Right Panel – this is where you will spend most of your time configuring various components or viewing any associated output from components contained in plans.

jmeter5ui

Continue reading

Measuring performance under load.

Load testing allows you to gather metrics on the performance and behavior of your application under normal or anticipated peak load conditions. This not only helps you make educated decisions about your application and environment but provides a level of confidence your users should not experience a degradation in performance or worse an outage. By being proactive and making course corrections when issues are encountered during tests.

It involves putting sufficient load on an application while it remains up and running so you are able to gather metrics about the applications performance and the environment. These metrics should include things like throughput-rates, response times, memory consumption and CPU utilization.

Continue reading