Performance tools, like dotTrace profiler are really useful when trying identify potential bottlenecks in your Sitecore application. Normally, attaching to the w3wp.exe process and profiling your local Sitecore instance is relatively straightforward, however now that we are taking advantage of Docker and running our instances in containers the process is slightly different. In this post I’ll show you how to profile your Sitecore instance running in containers.
The approach is similar to how you would profile a remote instance using the remote agent, lets go through the steps.
1. Map dotTrace RemoteAgent Port
The remote agent runs off port 9100. So you will want to map this port in your docker compose file and run docker compose up -d. In my compose file I mapped 44910:9100.
2. Copy Remote Agent to your Container
Locate the RemoteAgent.zip which is installed as part of DotTrace installation (C:\Users\[username]\AppData\Local\JetBrains\Installations\dotTrace[N]). You will want to unzip it locally as we are going to copy it to a directory on the Sitecore container to be profiled.
PS> docker cp c:\tools\remoteagent\. <container id or name>:/remoteagent
With your containers running you can attempt to copy the remote agent to your desired container, however you will most likely run into the following error:
Error response from daemon: filesystem operations against a running Hyper-V container are not supported
To get around this you can stop the container, copy the remote agent and then start the container with the following command:
PS> docker stop <container name/id>
PS> docker cp c:\tools\remoteagent\. <container name/id>
:/remoteagent
PS> docker start <container id or name>
3. Start Remote Agent
The agent has been copied it can be started either via the following.
PS> docker exec -d <container name/id> remoteagent/RemoteAgent.exe
Alternatively if you want to verify it has indeed been copied open a powershell window into the the container and navigate to the directory and start the RemoteAgent.exe.
PS> docker exec -it <container name/id> powershell
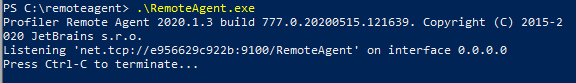
4. Connect to RemoteAgent
You should be able to connect to the remote agent and begin profiling. Use the following address to connect: net.tcp://localhost:[mapped port step 1]/RemoteAgent and click Connect.

5. Select Profile Application & Profiler Options
Once connected select IIS as the Profile Application and choose your profiler options.

If you are not familiar with dotTrace, these options allow you to profile your application slightly differently:
- Sampling – this is the fastest but least precise. While it can measure calls time accurately, it does not get data on the number of calls. probably the most command as it useful for trying to identify potential bottlenecks for the first time.
- Tracing – slower than sampling as it accurately measures how many times a particular method was called. You should use this method when the Sampling data is not enough, e.g. if you need to evaluate the complexity of your methods.
- Line-by-line – this is the slowest method as it measures each line of code. This is useful only when you know what function is causing the issue and you want to analyze each line of it.
- Timeline – records application events and writes data about how application state changed during the profiling session. Useful for identifying excessive GC or IO operations.
You can also configure the way execution time is measured:
- Real Time (CPU instruction) – is time elapsed between method entry and method exit. doTrace uses the TSC processor register to measure the time spent between method enry and exit.
- Real time (performance counter) – is time elapsed between method entry and method exit. doTrace uses the Performance Counter API to retrieve data from the OS, network and devices to determine how the application is performing.
- Thread time – is the time measured by a thread-specific timer which is paused when its thread is paused. This kind of measurement is supported only for sampling profiling.
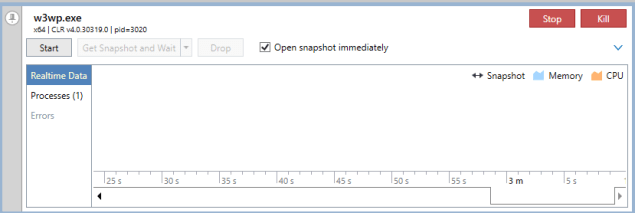
6. Attach to w3wp.exe
Once you have selected your options click Run and hit the Url for your Sitecore container instance. You should see the w3wp.exe process appear and the Start button should now be enabled.
7. Start Profiling
When you get to the point in your application you want to profile click Start and perform the actions you want to profiling.
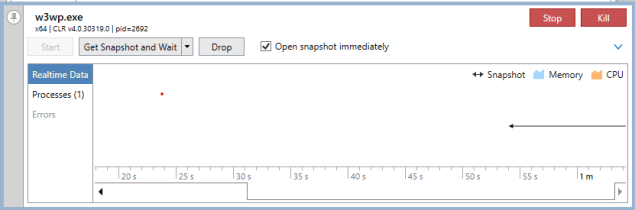
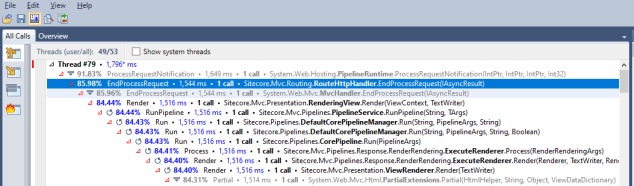
8. Take Snapshot
Once completed performing the actions click Get Snapshot and Wait. dotTrace will open the captured application profile.
Note: If you are continuously using dotTrace to profile your containerized Sitecore instances then you should probably consider modifying the container images to include the RemoteAgent. As the RemoteAgent will be removed when you docker-compose down.
Happy Profiling!

Great post! It’s still very up to date after 4 years. Thanks!
LikeLike
This blog post provides a clear guide on how to profile Sitecore instances running in containers.
LikeLike