JMeter is my tool of choice for load testing. This isn’t necessarily a load test but rather a useful script to crawl site urls using a sitemap. By hitting every accessible url allows Sitecore to populate all the various caches and provides you with a sense of the potential sizes of the various Sitecore caches and helps you identify any tuning that may be required.
Continue readingJMeter
Capture & Monitor JMeter metrics in real-time with InfluxDB & Grafana
The JMeter GUI is great for creating and debugging test plans, however, as I have mentioned in a previous post it is not recommended for running your actual test plan. JMeter is simply not designed to produce high loads in GUI mode, as it can consume a lot of resources and potential produce unreliable load test results. While it is recommended you run your actual test in CLI mode, this means you have to wait until the test is complete before you can see the results. While this might be okay for short tests but for longer running soak tests you might want to examine the results while the test is running. In this post, I will show you how this can be achieved using InfluxDB and Grafana.
The Tools
InfluxDB is a time-series database built for high-performance handling of time-stamped data. JMeter provides a backend listener InfluxdbBackendListenerClient to write the data to InfluxDB. Grafana is an open-source metric analytics and visualization suite. It is most commonly used for visualizing time series data for infrastructure and application analytics. Continue reading
Load Testing with JMeter Advanced
In my previous post in this series on load testing I provided an introduction to JMeter to help get you started in this post I’ll explore the following topics and provide solutions to some challenges you may come across while creating your load tests.
- GUI Mode vs CLI Mode
- Make use of HTTP Defaults
- Make use of HTTP Cookie Manager
- Use Variables, Properties & Functions in your test plan
- How to configure your Test plan for Multiple Environments
- How to add a degree of variance to your Scenarios
- Speed up test scenario creation with Script Recorder
- Install the JMeter Plugin Manager
- Useful Thread Plugins worth checking out
- How to Generate the HTML Report Dashboard
- Optimize Your JMeter Test Environment
Load Testing made easy with JMeter
In my previous post, I looked at the importance of load testing. In this next post in this series on load testing, I will show you how to use JMeter to create a simple load test, take a look at the various JMeter’s components and some features you should familiarize yourself with to help make load testing easy.
- JMeter is a Java application as a pre-requisite you will need to install the latest 64bit JDK or JRE.
- Download the latest binaries and unzip to a directory, for example, c:\jmeter.
- To run navigate to the \bin directory and run Jmeter.bat or if you are on a mac jmeter.sh.
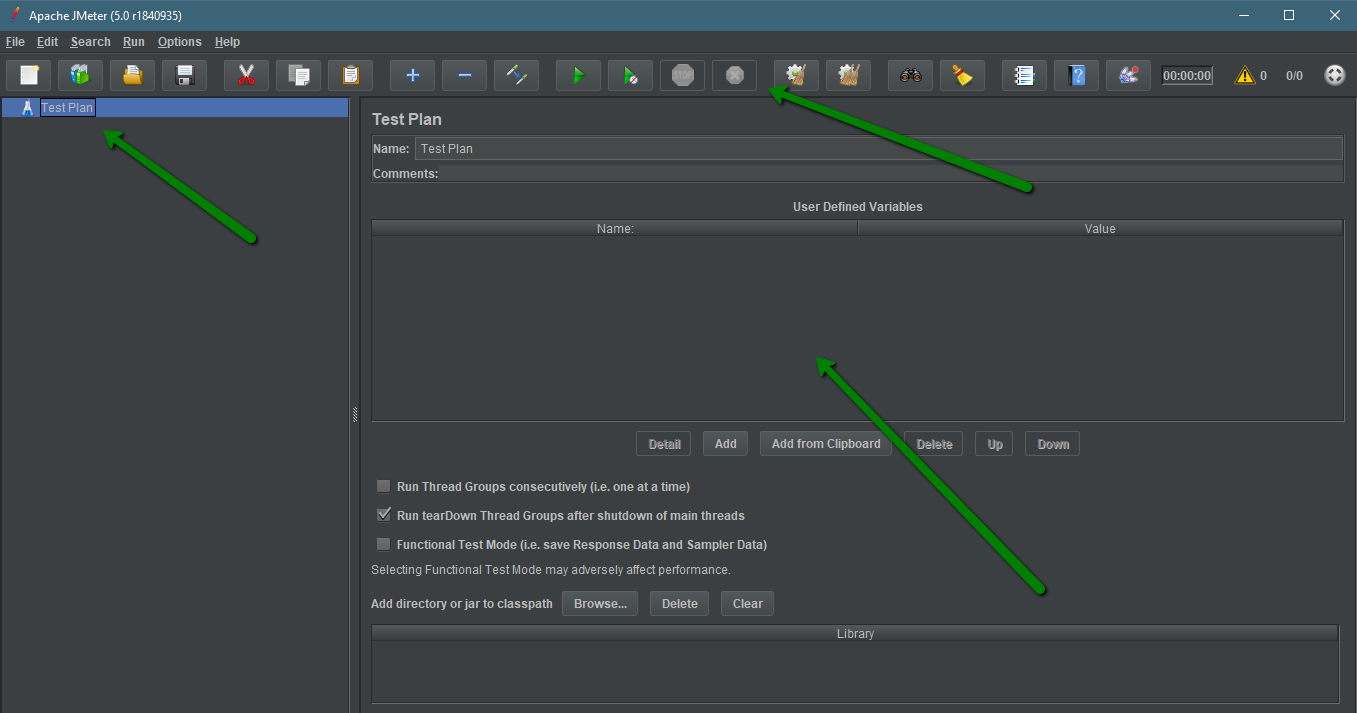
JMeter UI overview
The UI is divided into three main functional areas:
- Menu bar – provides access to a lot of the main functions and provides relevant information to current running tests.
- Left panel – contains a hierarchical tree view of one or more test plans and the various components contained in the plans.
- Right Panel – this is where you will spend most of your time configuring various components or viewing any associated output from components contained in plans.
Measuring performance under load.
Load testing allows you to gather metrics on the performance and behavior of your application under normal or anticipated peak load conditions. This not only helps you make educated decisions about your application and environment but provides a level of confidence your users should not experience a degradation in performance or worse an outage. By being proactive and making course corrections when issues are encountered during tests.
It involves putting sufficient load on an application while it remains up and running so you are able to gather metrics about the applications performance and the environment. These metrics should include things like throughput-rates, response times, memory consumption and CPU utilization.

