The JMeter GUI is great for creating and debugging test plans, however, as I have mentioned in a previous post it is not recommended for running your actual test plan. JMeter is simply not designed to produce high loads in GUI mode, as it can consume a lot of resources and potential produce unreliable load test results. While it is recommended you run your actual test in CLI mode, this means you have to wait until the test is complete before you can see the results. While this might be okay for short tests but for longer running soak tests you might want to examine the results while the test is running. In this post, I will show you how this can be achieved using InfluxDB and Grafana.
The Tools
InfluxDB is a time-series database built for high-performance handling of time-stamped data. JMeter provides a backend listener InfluxdbBackendListenerClient to write the data to InfluxDB. Grafana is an open-source metric analytics and visualization suite. It is most commonly used for visualizing time series data for infrastructure and application analytics.
Setting up InfluxDB
Simply download InfluxDB and unzip to your desired directory, for example, c:\jmeter\influxdb
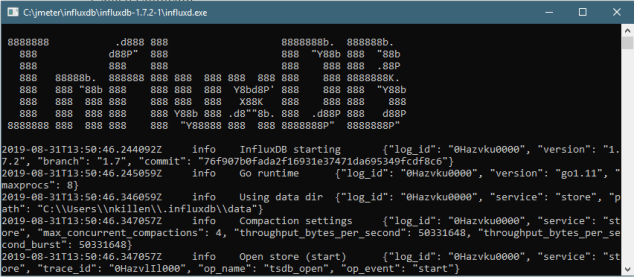
- To start InfluxDB navigate to /bin directory and double click the influxd.exe.
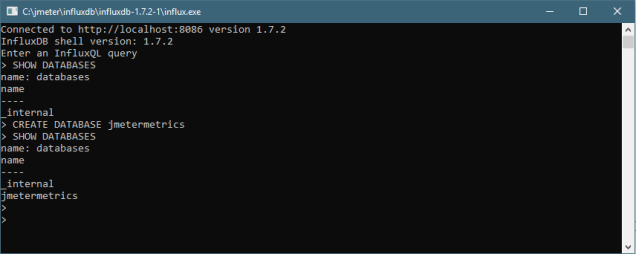
- We need to create a database for storing our JMeter load test data. In the /bin directory double click Influx.exe.
- Run the SHOW DATABASES command – this will give you a list of databases.
- Run the command: CREATE DATABASE jmeterresults
- Run SHOW DATABASES again and you should see your new database listed.
- We are done with Influxdb.
Setting up JMeter
For this demonstration, I will be using the JMeter test project from my previous post to show you how to configure the backend listener to write metrics to InfluxDB.
- Add a new backend listener to the thread group
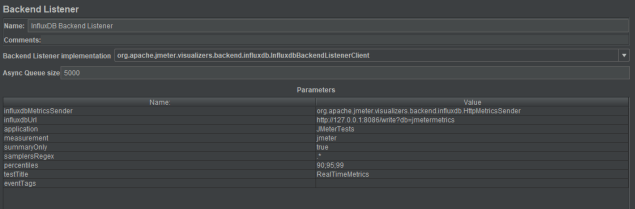
- Change its name to InfluxDB Backend Listener
- In the Backend Listener Implementation dropdown select org.apache.jmeter.visualizers.backend.influxdb.InfluxdbBackendListenerClient
- Configure the parameters as follows:
- influxdbMetricsSender – this is the class for sending metrics to InfluxDB. keep it as default.
- influxdbUrl – this is the URL of InfluxDB is in the following format: http://%5Binfluxdb_host%5D:%5Binfluxdb_port%5D/write?db=%5Bdatabase_name%5D. As we have created the “jmetermetrics” database and we are running it on a local machine with a default port, then, in our case, the URL will be http://127.0.0.1:8086/write?db=jmetermetrics.
- application – we can store metrics from different applications under one database.
- measurement – the name of the measurement that will be stored in InfluxDB. Use default ‘jmeter’.
- summaryOnly – if you want to keep summary results in the database and do not want to collect all the detailed metrics during test execution set to ‘true’.
- samplersRegexp – use the regexp expression to filter specific metrics which you want to store in a database. Use the default “.*” value if you want to store all your metrics.
- percentiles – metrics percentiles that should be sent to the database.
- testTitle – give your test a name.
- eventTags – a list of tags which will be stored in the ‘events’ measurement of InfluxDB.
- We are done with the Listener Setup.
Setting up Grafana
Grafana is an open-source metrics analysis and monitoring/visualization tool. It works really well with time series data like InfluxDB.
- Download Grafana and extract the zip to a directory of your choosing, for example, c:\jmeter\Grafana.
- Before running you will want to make some changes to the default configuration. Locate the following file /conf/sample.ini and copy it to /conf/custom.ini
- We will use this custom.ini to patch our changes. You should never change the defaults.ini file directly.
- Grafana by default is configured to use port 3000 if this port is already in use you may need to change it. Edit custom.ini uncomment http_port and modify the port.
- To start Grafana navigate to the /bin directory and run grafana-server.exe.
- Browse to http://localhost:3000
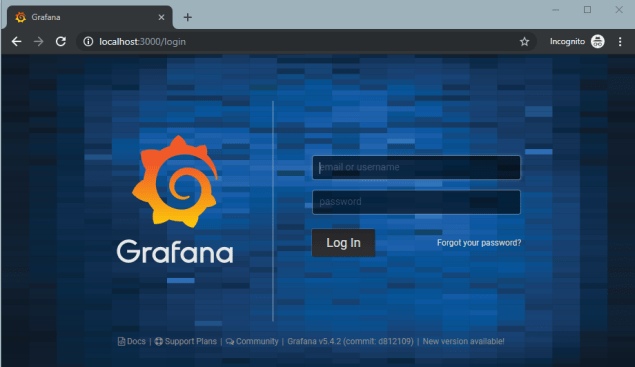
- The default username/password is admin/admin this can be changed or during startup when prompted.
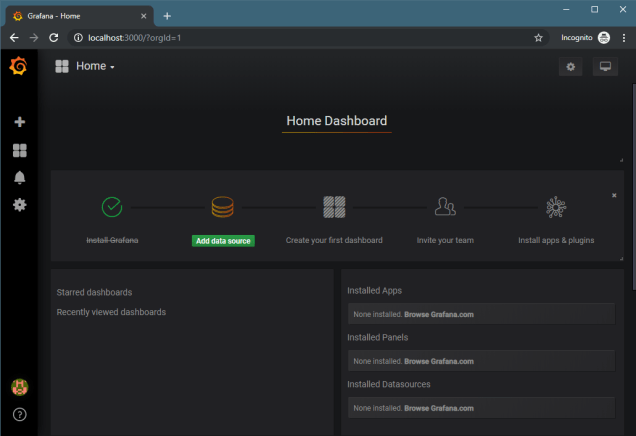
- Once logged in you will be presented with the Home Dashboard. From here you can create data sources, manage users, create report dashboards etc.
- The first thing we need to do is create a data source to pull data from our InfluxDB. Click Add Data Source and choose InfluxDB as the data source type. Specify the url: http://localhost:8086 and the name of the influxdb database we created earlier: jmetermetrics. You can also configure other settings for authentication. Click Save & Test hopefully you should see the Data source is working.
- Next, we are going to need a dashboard. You could create one from scratch however, to get us up and running quickly we are going to import an existing dashboard.
- Click Add Dashboard to locate existing dashboard screen click the link Find Dashboards On Grafana.com. From here you can browse and search for available dashboards. If you search for JMeter you will discover several available for displaying JMeter metrics. We are going to choose Apache JMeter Dashboard using Core InfluxdbBackendListenerClient by Philippe M. copy the dashboard ID: 5496.
- Switch back to Grafana and the create dashboard screen and click Import Dashboard enter the dashboard ID we copied 5496 and click Load.
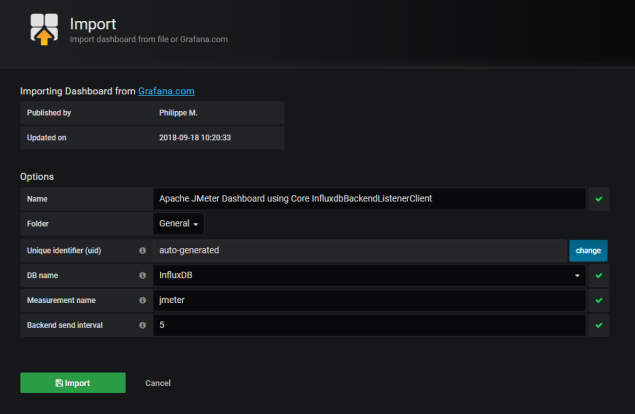
- On the import dashboard screen you will be prompted for the following:
- Name – specifiy the dashboard name
- Folder – Grafana allows you to organize dashboards into folders.
- DB name – select the InfluxDB data source we created in step 9
- Measurement name – we will set this to ‘jmeter’ not it is the same measurement we defined when we setup the JMeter Listener and is the table in our InfluxDB database.
- Backend send interval – this should match the JMeter property backend_influxdb.send_interval which default value is 5 seconds.
- Our dashboard will be displayed as you would expect with no data displayed as we’ve don’t have any tests running and there is no data in our InfluxDB.

- We are done with Grafana setup.
Running your Test
Now for the easy bit switch back to JMeter and start the test. We should start to see JMeter metrics appearing in your grafana dashboard after 5 seconds and automatically updating every 5 seconds until our load test completes.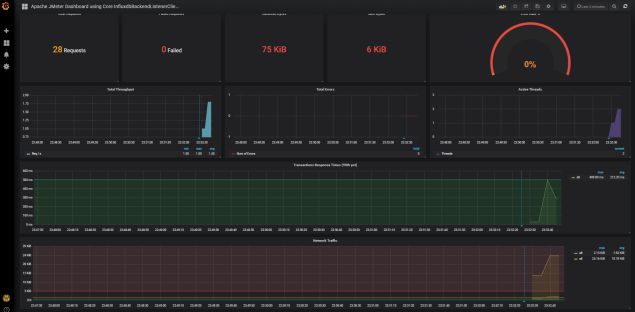
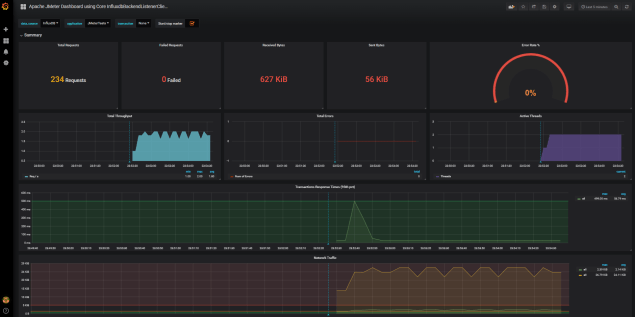
One of the nice features with Grafana is that it provides several ways to manage the time ranges of the data being visualized. 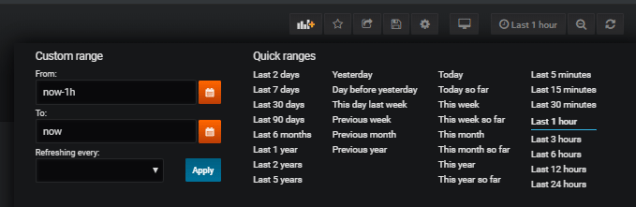
It also allows you to take snapshots and export dashboard so they can be easily compared or shared and lots of other neat features. I highly recommend checking it out.
We can also verify the data in our InfluxDB by querying our database using the Influx.exe command-line interface.
- You need to tell InfluxDB which database you want to use run the command ‘use jmetermetrics’
- Now you can query the database lets run a simple select statement to retrieve records in our jmeter run ‘SELECT * FROM jmeter’
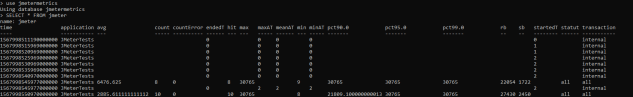
- All our JMeter metrics are readily available for us to query and report on.
Additional Info
- InfluxDB download
- Install Grafana on Windows
- Install Grafana on Mac
- Grafana Getting Started
- Grafana Configuration
- Grafana Dashboards
- Load Testing with JMeter Advanced
- Load Testing made easy with JMeter
- Measuring performance under load.
Happy Testing!!
