In my previous post in this series on load testing I provided an introduction to JMeter to help get you started in this post I’ll explore the following topics and provide solutions to some challenges you may come across while creating your load tests.
- GUI Mode vs CLI Mode
- Make use of HTTP Defaults
- Make use of HTTP Cookie Manager
- Use Variables, Properties & Functions in your test plan
- How to configure your Test plan for Multiple Environments
- How to add a degree of variance to your Scenarios
- Speed up test scenario creation with Script Recorder
- Install the JMeter Plugin Manager
- Useful Thread Plugins worth checking out
- How to Generate the HTML Report Dashboard
- Optimize Your JMeter Test Environment
GUI Mode vs CLI Mode
It is recommended that you use JMeter GUI mode for the creation and debugging of your test plan. Once the Test plan is created you should switch to running your test using the CLI mode for the following reasons:
- High thread count causes the JMeter to crash in GUI mode.
- Intensive test scenarios with several logic controllers can cause JMeter to consume memory and CPU and can affect your test results.
- Increase JMeter capabilities, i.e. to get more requests per second.
You can use the following command to run CLI mode:
bin/jmeter -n –t pathtotestfile.jmx -l pathtoresultsfile.jtl
What if you need to stop your test running in CLI mode?
You can use the following commands located in the bin directory:
- bin/shutdown.cmd – will stop a CLI mode instance gracefully.
- bin/stoptest.cmd – will stop a CLI mode instance abruptly.
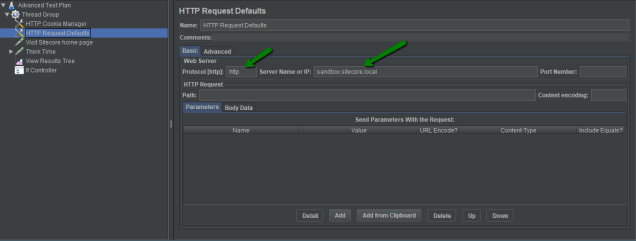
Make Use the HTTP Request Defaults
If you are going to send multiple requests to the same web server, consider using an HTTP Request Defaults configuration element so you do not have to enter the same information for each HTTP Request.
Make Use the HTTP Cookie Manager
If you want cookies to be handled properly by JMeter you will need to use the Cookie Manager. If you don’t use it then your test would function the same as a browser with cookies disabled. Each thread has its own cookie storage, so cookies are stored and are specific to each thread.
Use Variables, Properties & Functions in your test plan
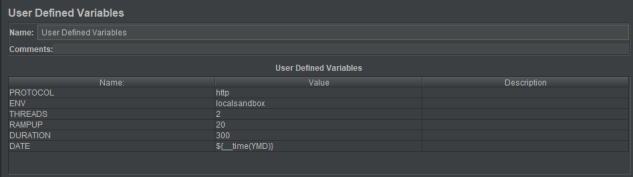
When configuring your thread groups instead of adding the values directly consider using variables instead. This will provide much greater flexibility when running your load test. For example, if you define the following variables:
- PROTOCOL – used to substitute the protocol value on HTTP Request Defaults.
- ENV – used to substitute the server name or ip value on HTTP Request Defaults.
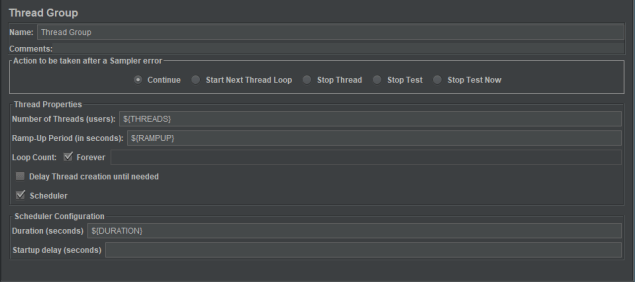
- THREADS – used to substitute the Number of threads value on Thread Group.
- RAMPUP – used to substitute the Ramp up period value on Thread Group.
- DURATION – used to substitute the Duration value on Thread Group.
- DATE – uses the Time function to obtain the date & time and is used in the results file name.
As you can see variables are defined with a value that is used when the test is ran alternatively you can use a Property as the value and properties can be configured to have a default value or can be passed to your load test at runtime in the command when running it in CLI mode. Properties are defined using the following shorthand ${__P([propertyname],[default value])}.

So now if I run this test in GUI mode it will use the default values that are defined for the properties and if I run it in CLI mode I have the option of overriding these defaults by setting those parameters in the command line making my test much more dynamic.
If you read my first post in this series on load testing you’ll remember I talked about different types of tests: baseline, stress and soak. Well, this is one way you can achieve that using the same test scripts without having to modify the script you just run it via the command with different parameters. This makes it easy to handoff to the DevOps team to run.
You may have noticed I used the time function to obtain the date and time to set my DATE variable, JMeter provides a number of built-in functions and you can create your own. I recommend checking to JMeter documentation to discover the various available functions.
How to configure your Test plan for Multiple Environments
More than likely you are going to have a number of different environments that you might want to run your load test against like DevInt, Test, Stage, and Production. You might even be fortunate enough to have a blue/green deployment model requiring even more environments for live and non-live instances. You also have Sitecore Content Delivery and Content Management instances you’ll want to test.
- The list of possible URLs you need to remember and maintain can grow quickly.
- You probably don’t want to manipulate your load test each time you need to point at a different environment.
- You also want to make easy for the test to be run by other members of a DevOps team.
- You might want to ensure someone does not make a mistake and accidentally run a load test against a live production environment.
Granted you won’t always run your load test against all of these environments all the time but it is likely you will want to at some point. So how do you best solve this? An easy method that works for me is the following:
- Create a simple CSV file with a header row and single value row. The column names should be concise friendly names for each environment/instance and add the environment specific URL defined for the value.
- Add a CSV Data set config element to your test plan and configure it to point to your CSV file.
- Copy all the header column names from your CSV and paste them into the variable names field.
- Add a User Defined Variable called ENV set the default value to the environment you wish to run the test against for example ${__P(ENV,${localsandbox}).
- Add HTTP Request Default config element and set the Server Name or IP value to the Environment variable ${ENV}.
- Now if you run your test in GUI mode it will use the ENV variable current default value and all test will hit that environment. If you want to change it just change this to another environment defined in the CSV data set.
- If you run your test via CLI mode you can pass in the value for the environment parameter.
How to add a degree of variance to your Scenarios
When you are creating your test scenarios you will want to introduce a degree variance in the requests being made by each thread in order to simulate real user behavior. Take for example an e-commerce site, not every user will browse the same product. If your test was configured to hit the same item each cycle it wouldn’t be a very good load test. Especially when you consider the levels of caching Sitecore performs under the hood. So how do you achieve this without creating a plethora of individual requests? Or define the variant values for each form you need to submit or search you want to perform? With JMeter, this is relatively straightforward by utilizing CSV data config sets. For example, you could achieve this with the following steps:
- Create all the HTTP requests necessary for a single thread or scenario, you can do this manually or with the Test Recorder depending on the size and complexity of the scenario.
- For each request identify the parameters that should be dynamic, this could be in the URL path or a field value on a form. Substitute each parameter with a JMeter variable ${variable name}.
- Create a CSV file for each type of data or requests you need to make. If for example, you had a test scenario that browsed for products you might have a Products.csv containing product information or if you had a user registration test scenario you would have a userregistration.csv containing user information. Each column in the header row of the CSV should contain the variable names identified in step 2 that you wish to populate dynamically when the test is run.
- Create a CSV Config element point it at your CSV file and copy the header row into the variables field.
- Populate the CSV files with variant data you could hand this off to the customer or QA tester to populate.
- For each thread, JMeter will read a random row from the CSV file and populate the variables that will be injected into your requests.
Speed up test scenario creation with Script Recorder
Instead of manually adding all you various samples for each scenario you could use Jmeters Test Script Recorder. This can save you a lot of time especially if you have forms or long complex scenarios. The recorder runs as a proxy to fire it simply:
- The quickest way to get started with the JMeter Test Recorder if you have never used it before is use the existing OOTB template.
- With your existing JMeter instance running fire up a new JMeter instance – yes you can have multiple instance running. Just double click the JMeter.bat file.
- In the instance click File – > Templates
- From the templates window, you can choose Recording or Recording with ThinkTime and click Create.

- This will create a test plan with the necessary components to start recording your scenarios.

- Configure your browser to work with JMeter proxy refer to step by step guide

- To start the recorder in JMeter click the Start button on the Test Script Recorder
- Perform the actions for your test scenario in the browser you configured in step 6.
- When you are finished stop the recorder.
- All actions performed will be captured under the test controller.
- You can simply copy these actions and paste them into your working test plan or into another running instance of JMeter. Yes you can copy components between running instances of JMeter.
- You can then manipulate the recorded test by adding variables, logic controllers and whatever is necessary to incorporate them into your own realistic test scenario.
- Note: Every request made by the browser will be recorded including images, javascript and CSS. However these can be filtered out to prevent these unnecessary requests. On the Requests filtering tab on the recorder, you can use the suggested exclusion or define your own exclusions.
Install the JMeter Plugin Manager
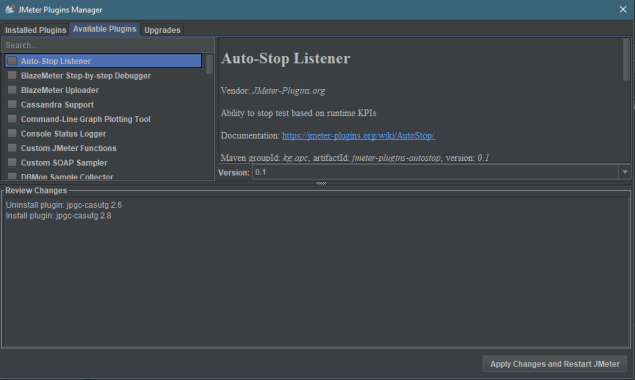
There are a number of plugins available for JMeter available at https://jmeter-plugins.org/. These are jar files and are installed by downloading and adding them following folder [jmeter install dir]\\lib\ext. Once installed you need to restart JMeter. However, there is a Plugins Manager install this first as it will allow show you installed plugins, allow you to browse available plugins and show any updates for your installed plugins.
Useful Thread Plugins worth checking out
Once you have the plugin manager installed you should check out the following thread groups for greater control and flexibility thread distribution.
- Concurrency Thread Group – makes it super easy to have control over the number of concurrent threads over time. It provides a nice visual graph of the concurrent threads plotted against time. To help you visualize the threads.

- Ultimate Thread Group – as the name suggests lets you create any possible combination of thread distribution you can dream up. The thread group table allows you It also displays your configured threads plotted against time in a nice visual graph.

How to Generate the HTML Report Dashboard
JMeter provides various forms of reporting to help you analyze the results of your load tests. The HTML JMeter dashboard provides the following additional metrics:
- APDEX
- Request Summary Graph
- A statistics table
- An Error Table
- Top 5 errors
- Zoomable Chart where you can analyze each transaction in depth.
You can generate the dashboard using the results file of your load test in either .jtl or .csv file format with the following command:
You can generate the HTML report as a stand-alone process from a sample log file or automatically after a load test is complete:
- jmeter -g -o
- jmeter -n -t -l -e -o
Optimize Your JMeter Test Environment
There are several steps you can take to ensure your test environment is optimized for running your load tests.
- If possible use 64bit OS to run you JMeter Tests as 32bit has a 4GB heap size limit.
- Check the heap space set for JMeter you can increase this to 80% of the available RAM.
- You will need to increase the heap space if you hit the out of memory issue.
- Check your CPU and memory usage while your tests are running when your thread count has reached its maximum and ensure CPU is running below 80% otherwise it could lead to inconsistent and invalid test results.
- It is not easy to determine how many threads you will manage to run on a single machine as it depends completely on the specific machine configuration. However, if you are unable to generate the desired load for your test then consider running JMeter distributed load tests.
Additional Resources
- JMeter best practices
- JMeter Plugins
- JMeter Test Script Recorder
- JMeter Functions and Variables
- Measuring Performance under load
- Load Testing made easy with JMeter
- Capture & Monitor JMeter metrics in real-time with InfluxDB & Grafana
Happy Testing Folks!!

One thought on “Load Testing with JMeter Advanced”