In a previous post I provided you with some techniques to help you monitor your Containerized Sitecore instance using native tools. Over the next few posts, I will show some of the common tools and techniques used for monitoring applications running in containers. When I initially started thinking about this I considered using InfluxDB as my time series DB to store the performance metrics and Grafana for visualizing and alerting. As both of these were already in my tool-set for load testing. However, the more I dug into monitoring container performance I quickly realized, Prometheus has established itself as the leading tool in this space and Docker also provides support for Prometheus – more on that later. So let’s start with an introduction to Prometheus and lay some foundations for a monitoring platform.
What is Prometheus?
Prometheus is an open-source application for monitoring systems and generating alerts. It can monitor almost anything, from servers to applications, databases, or even a single process. Prometheus monitors your defined targets by scraping metric data in a simple text format that is exposed by the target. Prometheus stores this metric data in a multi-dimensional data model by metric name and key/value in its timeseries database which can then be queried and retrieved using its own query language PromQL, in a nutshell.
Let’s take a quick look at the the main components and architecture that comprise of the Prometheus platform.

- Prometheus Server – collects metrics from various nodes and stores them locally in a time series DB. It works on a principle of scraping via a pull model over HTTP from the endpoints you configure to be monitored at regular intervals.
- Service Discovery – Prometheus contains built in integrations for many service discovery (SD) systems like Kubernetes and Azure.
- Alert manager – allows you to define alerts on the metrics collected so you can be notified of discrepancies or levels of interest enabling you to be proactive rather than reactive. The alerts can be delivered over multiple channels.
- Prometheus Web UI – Prometheus does come with its own user interface that you can use to check on the configuration, scraped nodes and query metrics. It also has some graphing capabilities for constructing queries and visualizing metrics.
- Push gateway – if nodes are not exposing an endpoint Prometheus has a push gateway. This API is useful for one-off jobs that run, capture the data, transform and push the data to Prometheus.
- Exporters – extract information and translate it into the Prometheus format and expose over an endpoint on the node for the server to scrape and ingest.
- Grafana – while you can visualize metrics in Prometheus the features are somewhat limited, however it does have an API which allows you to query and consume metrics in other application like Grafana, which is much superior tool when it comes to visualizing your metrics.
Prometheus metrics types
Prometheus provides four core metric types:
- Counters – used to represent values that increase and resets to zero when the process restarts.
- Gauge – used to represent a single numerical value that can arbitrarily increase or decrease.
- Histogram – track the size and number of events in buckets. This allows for aggregatable calculation of quantiles.
- Summaries – track the trends in events over time (10 minutes by default).
Spinning up an instance of Prometheus
While Prometheus can be downloaded and installed as a binary it is also available as a Docker image. If our application is running in a container it kinda makes sense for our monitoring application to also run in a docker container. Providing us with a consistent reusable monitoring tool-set that can be rolled out for all our environments.
PS> docker pull prom/prometheus
As you’ll discover this is a Linux container, thankfully you can run both Windows and Linux containers simultaneously. Stefan Scherer has packaged Prometheus in a Windows container and is worth checking out if you don’t want to run it in a Linux container.
Once you have your container you can spin up Prometheus exposed on the default port 9090:
PS> docker run -p 9090:9090 prom/prometheus
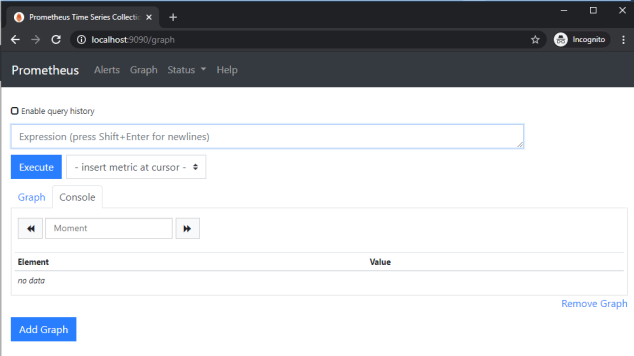
To check it’s up and running you should be able to browse to http://localhost:9090/ and see the Prometheus UI:
Configuring Prometheus
To configure Prometheus you need to define the targets to be scrape. A target is an endpoint that outputs metric data in a format Prometheus can ingest. Let’s look at an example config for our endpoint. While Prometheus can monitor other services, it also exposes data about itself, allowing it to scrape and monitor its own health – pretty clever! So let’s examine the following Prometheus.yml config file that target Prometheus – i’ve added comments to each setting for clarity:
| # global specifies parameters that are valid in all other configuration contexts. | |
| global: | |
| scrape_interval: 15s # how frequently to scrape targets by default. | |
| scrape_timeout: 10s # how long until a scrape request times out. | |
| evaluation_interval: 15s # how frequently to evaluate rules | |
| # Rule files specifies a list of globs. Rules and alerts are read from all matching files | |
| rule_files: | |
| # scrape_config section specifies a set of targets and parameters describing how to scrape them. | |
| scrape_configs: | |
| - job_name: prometheus #the job name assigned to scraped metrics by default. | |
| honor_timestamps: true # controls whether Prometheus respects the timestamps present in scraped data. | |
| scrape_interval: 15s # allows you to override the global setting - if required. | |
| scrape_timeout: 10s # again allows you to override the global setting - if required. | |
| metrics_path: /metrics # the path prometheus will scrape to obtain metrics from the target. | |
| scheme: http #string can be http or https. | |
| static_configs: #specify a list of targets | |
| - targets: | |
| - 127.0.0.1:9090 # Promotheus expose its own metrics data on port 9090 by default. |
The config file is divided into different sections:
- global section – specifies parameters that are valid in all other configuration contexts. They also serve as defaults for other configuration sections.
- rules_files – location of any rules to apply – we’ve not specified any.
- scrape_config – specifies a set of targets and parameters describing how to scrape them. Targets may be statically configured via the static_configs parameter or dynamically discovered using one of the supported service-discovery mechanisms.
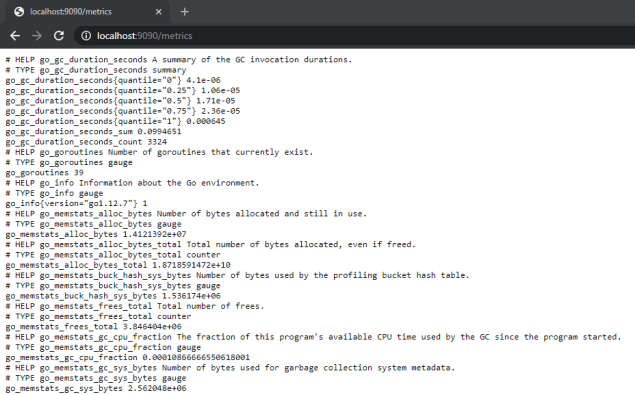
There are many more configuration options available for Prometheus and I recommend you familiarize yourself with them. Here’s a snippet of the metrics exposed by Prometheus:
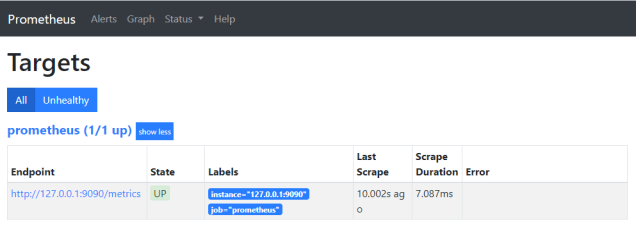
You can verify the status of a configured targets in Prometheus by selecting the Status Menu -> Targets. This will be useful as you add more targets to ensure Prometheus can connect and read metrics as expected.
 Docker Compose
As I am going to be running multiple containers, i’ll start with a simple docker compose file to define the various resources we will need. Allowing me to easily spin up and tear down those resources. I will add to this compose file as we introduce additional tooling for our monitoring platform.
| version: '2.4' | |
| networks: | |
| prom.local: | |
| services: | |
| prometheus: | |
| image: prom/prometheus | |
| volumes: | |
| - ./prometheus/config/:/etc/prometheus/ | |
| - ./prometheus/data:/prometheus | |
| command: | |
| - "--config.file=/etc/prometheus/prometheus_ver1.yml" | |
| networks: | |
| prom.local: | |
| ports: | |
| - '9090:9090' |
You will notice I have mounted two volumes:
- ./prometheus/config/:/etc/prometheus/ – allows me to map prometheus config file prometheus.yml
- ./prometheus/data:/prometheus – for persisting the metrics data captured.
Setting up Grafana
Grafana is an open-source metrics analysis and monitoring/visualization tool. It works really well with time series data like Prometheus. I won’t be going into the specific’s on Grafana. If you are not familiar with this tool, you can read about it here and I recommend checking out their getting started guide.
While you can download and install Grafana as binary, you can easily spin up an instance in a container using their docker image:
PS> docker run -d -p 3000:3000 grafana/grafana
I will modify my docker-compose file and include Grafana:
| grafana: | |
| image: grafana/grafana | |
| ports: | |
| - '3000:3000' | |
| networks: | |
| prom.local: |
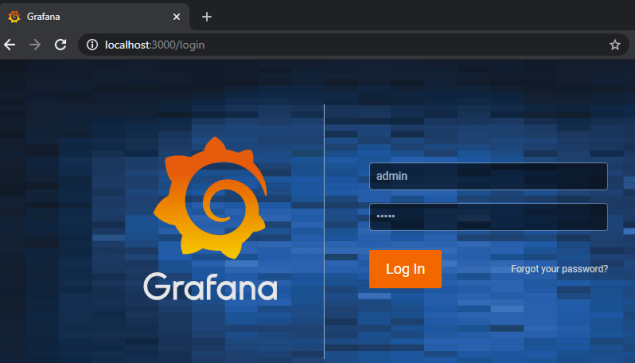
If I docker compose up I can verify Grafana is up running by hitting http://localhost:3000 and login with the default credentials admin/admin.
Add Prometheus Data source & Dashboard to Grafana
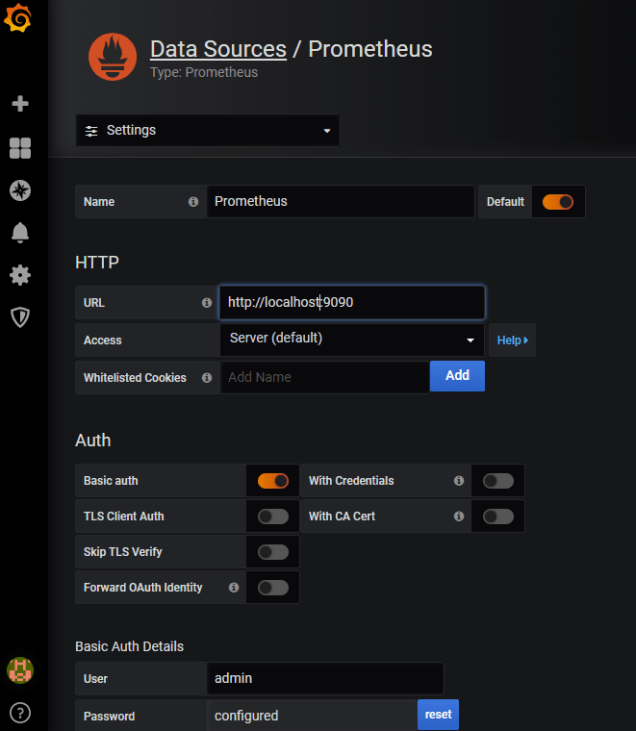
In order to connect Grafana to Prometheus I need to add a data source this is fairly straightforward:
- Open the Configuration menu in the sidebar and select Data Sources.
- Click the Add data source button.
- Select “Prometheus” as the type.
- Set the server URL for your Prometheus instance.
- Adjust other data source settings as required.
- Click “Save & Test” to save the new data source.
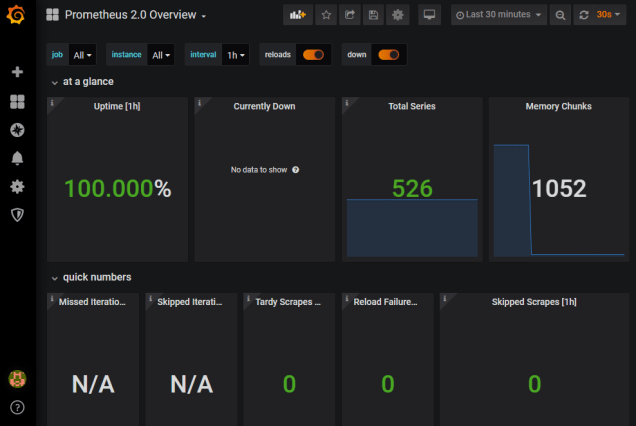
You can easily create your own custom dashboard by querying the Prometheus metrics or you can import an existing Prometheus Metrics Overview dashboard to get you started quickly.
Provisioning Grafana via Config files
Rather than having to manually add our Prometheus data sources and create the various dashboards for viewing our performance metrics in Grafana, if would be good to have these available and persisted when we start our container instance. Thankfully, Grafana allows us to provision both data sources and dashboards via yaml config files. These configurations can be added to your local file system and mounted into the Grafana container.
By creating a datasource.yml config I can define the details for my Prometheus data source. I’ll also create a dashboard.yml config to instruct Grafana where it can locate my dashboards. Both of these will be added to my file system along with the Prometheus 2.0 Overview dashboard json. I will update my docker-compose file with the volume mapping for Grafana.
| version: '2.4' | |
| networks: | |
| prom.local: | |
| services: | |
| prometheus: | |
| image: prom/prometheus | |
| volumes: | |
| - ./prometheus/config/:/etc/prometheus/ | |
| - ./prometheus/data:/prometheus | |
| command: | |
| - "--config.file=/etc/prometheus/prometheus_ver1.yml" | |
| networks: | |
| prom.local: | |
| ports: | |
| - '9090:9090' | |
| grafana: | |
| image: grafana/grafana | |
| volumes: | |
| - ./grafana/provisioning:/etc/grafana/provisioning/ | |
| - ./data/grafana/grafana_storage:/var/lib/grafana | |
| depends_on: | |
| - prometheus | |
| networks: | |
| prom.local: | |
| ports: | |
| - '3000:3000' |
If you noticed I added an additional mappings to persist my data in Grafana.
Additional Info
- Prometheus Overview
- Prometheus Configuration
- PromQL
- Running Windows and Linux Containers
- Configure Grafana Docker Image
- Run Grafana in a Container
- Provisioning Grafana
Stayed tuned for the next post in this series where I will continue to build a monitoring platform for a containerized Sitecore environment.
