Sometimes you run into scenarios where you cannot reproduce a bug/issue locally and requires you to investigate the issue on actual server where your are experiencing the issue. Now as it is a higher environment you most likely don’t have the luxury or at least you shouldn’t have Visual studio running on this environment where you could easily debug.
Thankfully though with the right tools and access you can easily setup remote debugging and step through the code as if it were running on your local environment and hopefully shine some a light on the problem.
First things first you are going to need to install a copy of the Remote Debugger (msvsmon.exe) on the Server if it is not already installed. You can obtain a link for the correct environment here along with some other useful information about setting it up.
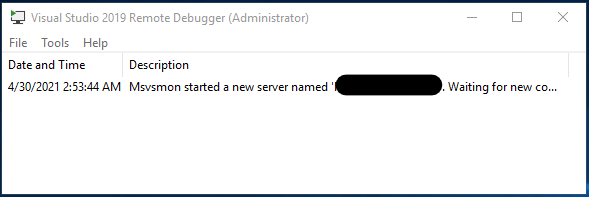
Once installed you will want to run the debugger as Administrator. If its the first time running the debugger you will be prompted to configure it. Follow these instructions to setup the remote debugger. When configuration is complete, the Remote Debugger window appears.
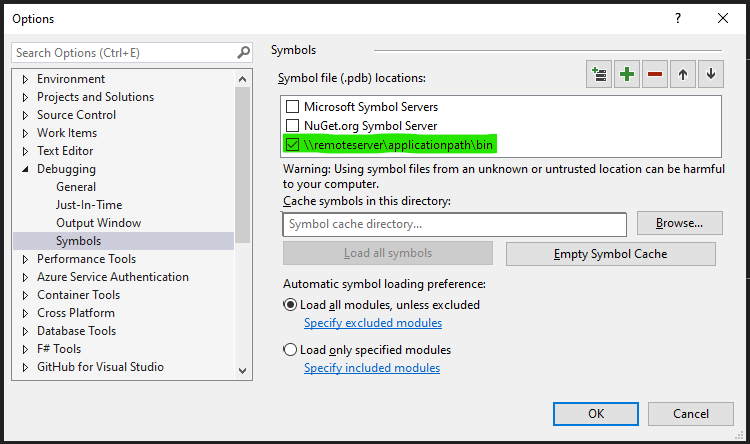
Next you are going to need to specify the location of the symbol files. You need to do this so that you can hit your breakpoints. These are different with each build therefore you’ll want to references the version of the files that were deployed to environment you are trying to debug. In Visual Studio under Tools -> Options -> Debugging -> Symbols allows you to specify the location of the symbols. Depending on you permissions there are a few way you can do this. If you have the sufficient permissions and could map a network drive to the location of the dlls and add the network location to the pdb’s.
Alternatively you can copy the pdb’s from the server to local directory and either specify this location in the symbol file locations or add the directory to the Cache symbols in this directory field.
Once you have done this you should be ready to start debugging. Attach the process and leaving the connection type as default and specify your remote server ip address and port 4024 (msvsmon.exe default port)

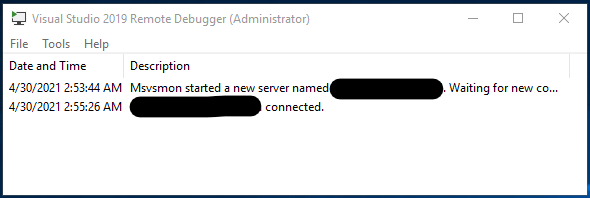
When you connect to the server with the correct ip and port (4024) you should see the connection appear in the remote debugger on the server indicating you have established a connection successfully.
Now you should be able to debug as if the application was running locally, however you will probably experience a little latency compared to running and debugging locally.
Useful Info
Happy debugging!


