So far in this series I have provided a brief introduction to Prometheus and shown you how you can configure Prometheus to monitor Docker and the HostOS metrics and visualize performance metrics using Grafana. In this post I’ll show how to instrument the Sitecore Solr Container to expose performance metrics for Prometheus to scrape display those metrics in Grafana. I’ll go into a bit more detail on Solr metrics, than what I shared during my Sitecore Symposum presentation: Insufficient facts always invite danger, Captain!, which is still available on demand.

Solr Metrics Api
Solr has made significant improvements in making performance related metrics available. In 6.4 they introduced the Solr Metrics API that exposes metrics which can be consumed by other applications. The api is accessible at the following url: http://localhost:8983/solr/admin/metrics

The metrics API provides different types of metrics (counter, meter, gauge, histogram, timer) and can out results for the following categories in either json or xml:
JVM registry – provides low level information on what is happening in Solr and within JVM (filter by group=jvm)
- direct and mapped buffer pools.
- class loading / unloading.
- OS memory, CPU time, file descriptors, swap, system load
- GC count and time.
- heap, non-heap memory and GC pools.
- number of threads, their states and deadlocks.
- System properties such as Java information, various installation directory paths, ports, and similar information.
Node registry – provides information related to the Solr node. You can filter the metrics api by specify parameter &group=node. This provides the following info:
- handler requests (count, timing): collections, info, admin, configsets, etc.
- number of cores (loaded, lazy, unloaded).
Core registry – includes solr.core.<collection>, one for each core. You can filter by group=core:
- all common RequestHandlers report: request timers / counters, timeouts, errors. Handlers that support process distributed shard requests also report shardRequests sub-counters for each type of distributed request.
- index-level events: meters for minor / major merges, number of merged docs, number of deleted docs, gauges for currently running merges and their size.
- shard replication and transaction log replay on replicas.
- open / available / pending connections for shard handler and update handler.
Jetty registry – provides statistics related to the servlet container in which Solr runs. You can filter by group=jetty:
- threads and pools.
- connection and request timers.
- responses by HTTP class (1xx, 2xx, etc.).
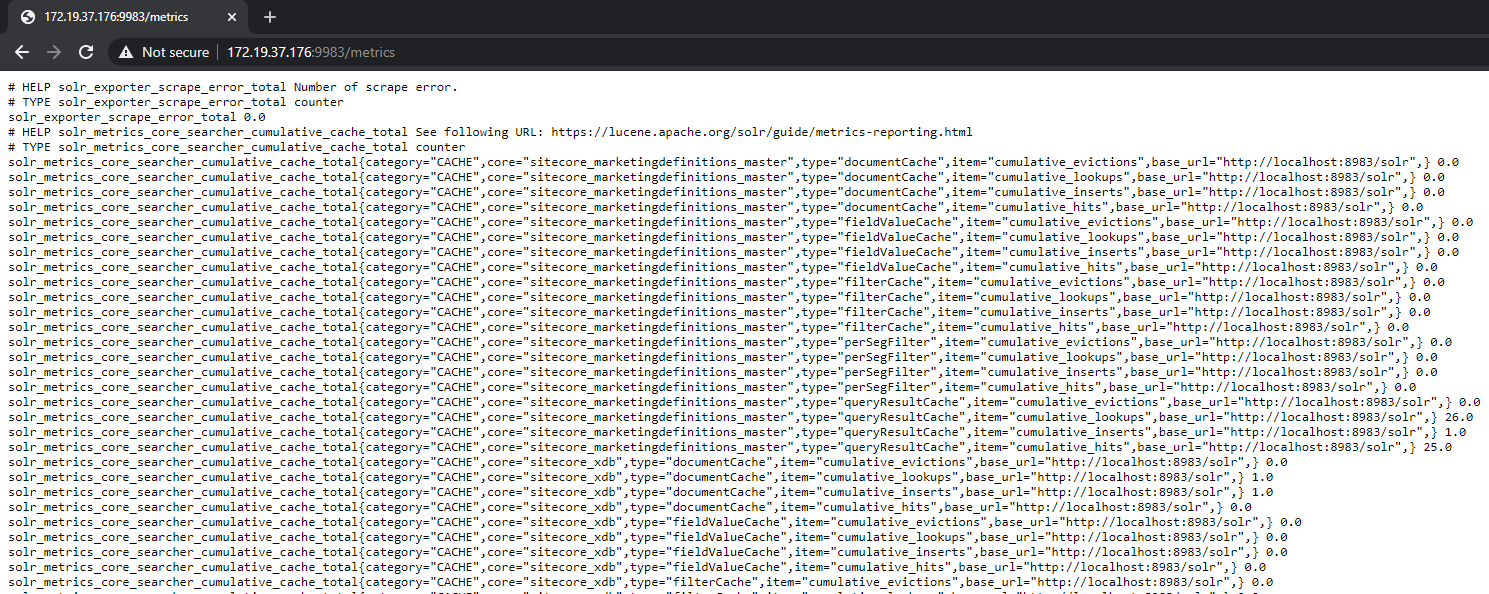
As you can see these metrics can provide some detailed information to help monitor the health and performance of your Solr instance but we need them in the Prometheus format to be able to scrape and query them with Prometheus. So we are going to need an exporter to transform them into the appropriate format and expose them on an endpoint.
Solr Exporter
Solr 7.3 and above includes a Prometheus exporter to collect these metrics. The solr-exporter allows you to monitor not only Solr metrics from Metrics API, but also facet counts which come from Searching and responses to Collections API commands or query any request handler.
The exporter was a separate project on github and was included in Solr 7.3 as a contrib project. So if you are running Sitecore 9.2 or above you already have this exporter in your solr container. The exporter is not running by default and must be started using the .\bin\solr-exporter.cmd located within c:\solr\contrib\Prometheus-exporter directory.

The exporter command has the following parameters:
- -h display command line help.
- -p the port for metrics to be exposed on for Prometheus to scrape.
- -b base url for example http://localhost:8983/solr when Solr is running in Standalone mode. If you are running Solr in SolrCloud mode, do not specify this parameter.
- -z the ZooKeeper connect string for example such as localhost:8983, or localhost:2181/solr when Solr is running in SolrCloud mode. If you are running Solr in Standalone mode, do not specify this parameter.
- -f the path to the configuration file that defines the Solr metrics to collect.
- -n the number of threads. The solr-exporter creates thread pools for requests to Solr. Request latency can be improved by increasing the number of threads (default is 1).
You can modify the metrics exposed by the exporter using the configuration file. Solr provides an example config file to get you started this is located in contrib/prometheus-exporter/conf/solr-exporter-config.xml. It includes the metrics from the API, but can also include queries to the Collections API, and can query any request handler. I’ve included list of the default metrics below.
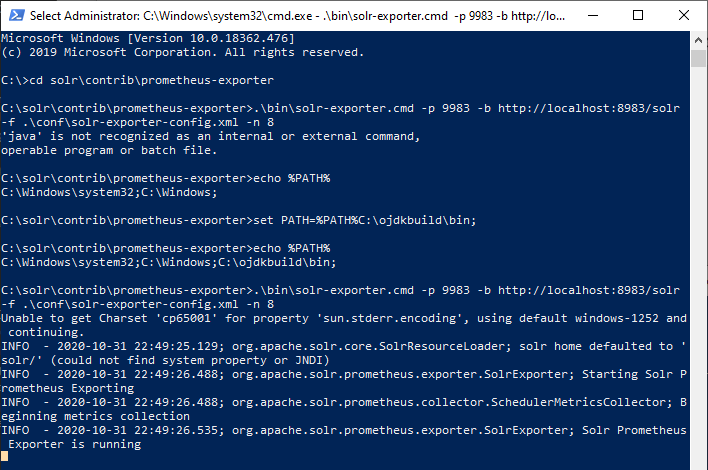
Environment Variable Gotcha
The first time trying to run the exporter I ran into an issue caused by the exporter not being able to locate Java runtime, as you can see below. To resolve this you need to add the runtime location to the PATH environment variable. This can be set manually or in Sitecore docker compose file.
Docker Compose
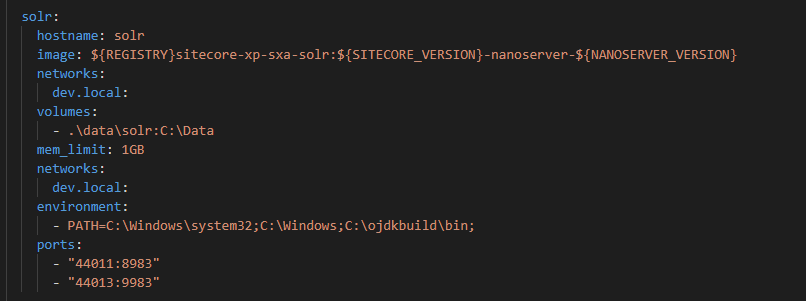
If we modify the Docker Compose and add a port mapping for the Solr Exporter port and also include the PATH environment variable.
Configure Prometheus
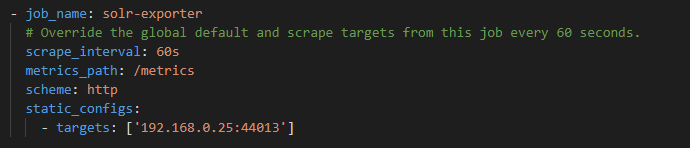
Now that metrics are being exposed by Solr we can add a new job to the Prometheus configuration to scrape these metrics. We can verify Prometheus is able to scrape the solr exporter target using the Status view and confirm our new job is running and Prometheus is scraping metrics.
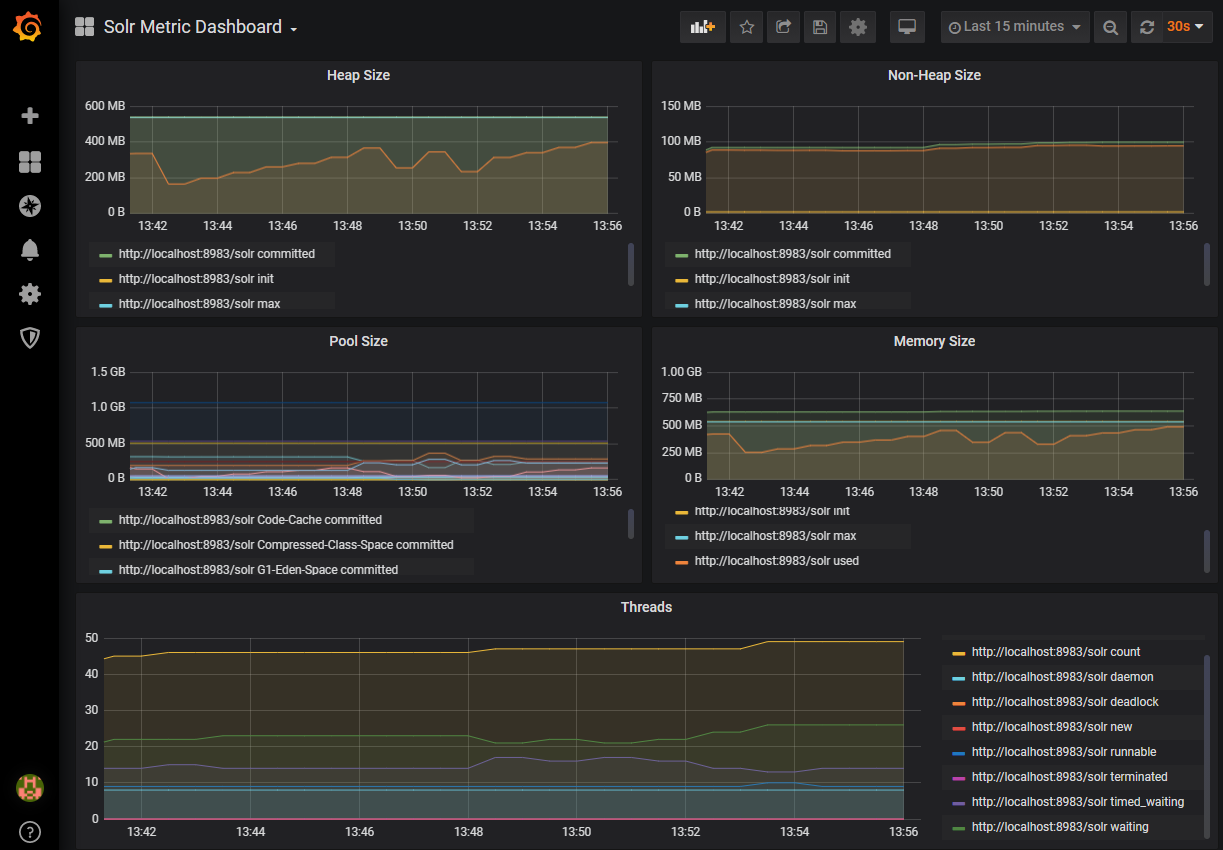
Grafana Dashboard
Now that our metrics are being scrape we can create a dashboard in Grafana to monitor those metrics. Solr provides a decent example dashboard for us, simply add the following JSON file: contrib/prometheus-exporter/conf/grafana-solr-dashboard.json to your Grafana instance and ensure it is pointing at your Prometheus datasource.
Supporting Earlier versions
As I mentioned the exporter is included in Solr 7.3 this is great if you are running Sitecore 9.2 or above as you will have the exporter already in your Solr container. But what if you are running an earlier version of Sitecore and want to scrape Solr the exporter is available on GitHub and can be copied to your container as long as you are running a compatible version of Solr with the metrics api.
Default Metrics Exposed
Information on the metrics can be found on Metrics Reporting guide and Collections API guide.
| Metric | Type | Category |
| solr_metrics_jetty_response_total | Counter | Jetty |
| solr_metrics_jetty_requests_total | Counter | Jetty |
| solr_metrics_jetty_dispatches_total | Counter | Jetty |
| solr_metrics_jvm_buffers | Gauge | JVM |
| solr_metrics_jvm_buffers_bytes | Gauge | JVM |
| solr_metrics_jvm_gc_total | Counter | JVM |
| solr_metrics_jvm_gc_seconds_total | Counter | JVM |
| solr_metrics_jvm_memory_heap_bytes | Gauge | JVM |
| solr_metrics_jvm_memory_non_heap_bytes | Gauge | JVM |
| solr_metrics_jvm_memory_pools_bytes | Gauge | JVM |
| solr_metrics_jvm_memory_bytes | Gauge | JVM |
| solr_metrics_jvm_os_memory_bytes | Gauge | JVM |
| solr_metrics_jvm_os_file_descriptors | Gauge | JVM |
| solr_metrics_jvm_os_cpu_load | Gauge | JVM |
| solr_metrics_jvm_os_cpu_time_seconds | Gauge | JVM |
| solr_metrics_jvm_os_load_average | Gauge | JVM |
| solr_metrics_jvm_threads | Gauge | JVM |
| solr_metrics_node_errors_total | Counter | Node |
| solr_metrics_node_requests_total | Counter | Node |
| solr_metrics_node_server_errors_total | Counter | Node |
| solr_metrics_node_timeouts_total | Counter | Node |
| solr_metrics_node_time_seconds_total | Counter | Node |
| solr_metrics_node_cores | Gauge | Node |
| solr_metrics_node_core_root_fs_bytes | Gauge | Node |
| solr_metrics_node_thread_pool_completed_total | Counter | Node |
| solr_metrics_node_thread_pool_running | Gauge | Node |
| solr_metrics_node_thread_pool_submitted_total | Counter | Node |
| solr_metrics_node_connections | Gauge | Node |
| solr_metrics_core_client_errors_total | Counter | Core |
| solr_metrics_core_errors_total | Counter | Core |
| solr_metrics_core_requests_total | Counter | Core |
| solr_metrics_core_server_errors_total | Counter | Core |
| solr_metrics_core_timeouts_total | Counter | Core |
| solr_metrics_core_time_seconds_total | Counter | Core |
| solr_metrics_core_field_cache_total | Counter | Core |
| solr_metrics_core_searcher_cache | Gauge | Core |
| solr_metrics_core_searcher_cache_ratio | Gauge | Core |
| solr_metrics_core_searcher_warmup_time_seconds | Gauge | Core |
| solr_metrics_core_searcher_cumulative_cache_total | Counter | Core |
| solr_metrics_core_searcher_cumulative_cache_ratio | Gauge | Core |
| solr_metrics_core_fs_bytes | Gauge | Core |
| solr_metrics_core_highlighter_request_total | Counter | Core |
| solr_metrics_core_index_size_bytes | Gauge | Core |
| solr_metrics_core_replication_master | Gauge | Core |
| solr_metrics_core_replication_slave | Gauge | Core |
| solr_metrics_core_searcher_documents | Gauge | Core |
| solr_metrics_core_update_handler_adds | Gauge | Core |
| solr_metrics_core_update_handler_auto_commits_total | Counter | Core |
| solr_metrics_core_update_handler_commits_total | Counter | Core |
| solr_metrics_core_update_handler_adds_total | Counter | Core |
| solr_metrics_core_update_handler_deletes_by_id_total | Counter | Core |
| solr_metrics_core_update_handler_deletes_by_query_total | Counter | Core |
| solr_metrics_core_update_handler_errors_total | Counter | Core |
| solr_metrics_core_update_handler_deletes_by_id | Gauge | Core |
| solr_metrics_core_update_handler_deletes_by_query | Gauge | Core |
| solr_metrics_core_update_handler_pending_docs | Gauge | Core |
| solr_metrics_core_update_handler_errors | Gauge | Core |
| solr_metrics_core_update_handler_expunge_deletes_total | Counter | Core |
| solr_metrics_core_update_handler_merges_total | Counter | Core |
| solr_metrics_core_update_handler_optimizes_total | Counter | Core |
| solr_metrics_core_update_handler_rollbacks_total | Counter | Core |
| solr_metrics_core_update_handler_soft_auto_commits_total | Counter | Core |
| solr_metrics_core_update_handler_splits_total | Counter | Core |
| solr_collections_live_nodes | Gauge | Collections |
| solr_collections_pull_replicas | Gauge | Collections |
| solr_collections_nrt_replicas | Gauge | Collections |
| solr_collections_tlog_replicas | Gauge | Collections |
| solr_collections_shard_state | Gauge | Collections |
| solr_collections_replica_state | Gauge | Collections |
| solr_collections_shard_leader | Gauge | Collections |
Useful links
- Monitoring Sitecore Container environment with Prometheus
- Monitoring Sitecore Container environment Host OS and Docker
- Monitoring Solr with Prometheus & Grafana
- Solr Compatibility Table
- Solr Dashboard
- Solr-Exporter
Happy Monitoring!
