One of the challenges with having a pull model like Prometheus is that it needs to know where the targets are located so it can scrape the metrics. While we can configure static scrape targets in the Prometheus configuration file directly for our local environment I discovered anytime I want to make changes to these setting or add a new target I must restart Prometheus. This can be very annoying, as compared to my Sitecore containers, the Prometheus container takes much longer to stop and restart. So I needed to find a better solution for configuring these targets locally.
Service Discovery
Service Discovery helps solve the problem of identifying scrape targets which is really useful in an orchestrated environment as it will dynamically discover targets. There is support for several common services like:
There are several other methods of Service Discovery supported by Prometheus:
<dockerswarm_sd_config>(scrape targets from docker swarm)- <azure_sd_config> (scrape targets from Azure VMs)
- <sc2_sd_config> (scrape targets from AWS EC2 instances)
- <kuberenetes_sd_config> (scrape targets from kubernetes)
File Discovery
Using a file based service discovery allows you to add new or change existing targets dynamically. So rather than defining our static targets in the prometheus.yml file directly we can add them in a separate YAML or JSON and then reference them in the Prometheus configuration. Any changes to these targets will be picked up dynamically by Prometheus.
If we take a look at a previous post where I’ve configured Prometheus to scrape the HostOS and the Docker engine metrics we could change this to use file sd instead. Do rather than defining the static targets in the prometheus.yml file could move them into a separate targets.json file which we can add to the same location as the configuration file which is already mounted in our docker-compose file when we configure Prometheus.
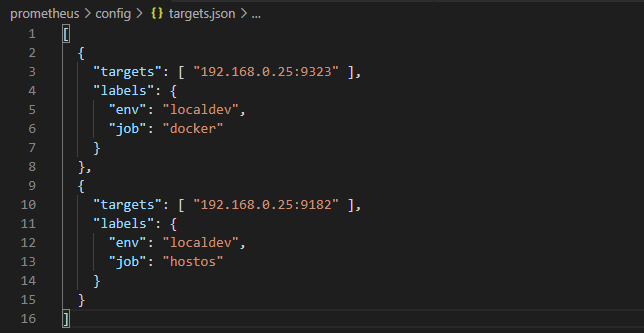
We would also update the prometheus.yml config file and change the scrape_configs to use a file_sd_config pointing it at our targets.json file which we added to the same directory as the configuration file:

Now when we docker-compose up and look at our scrape target status view in Prometheus we should see both our Host and Docker targets being scraped.

No more waiting for Prometheus container to restart when I need to add or update existing targets. We simple modify the targets.json and Prometheus will automatically update the scrape targets. Lets test it out and add Prometheus as a target.

The default refresh interval to re-read the targets.json is set to 5 minutes and you could override this value. Once the targets.json is re-read we see the Prometheus scrape target appear in our list of targets.

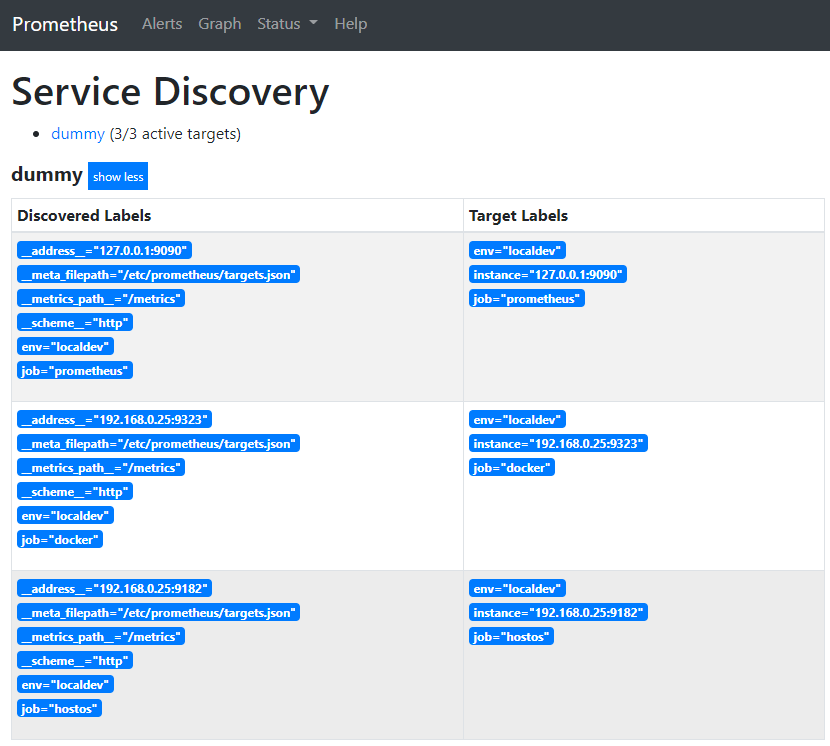
Service Discovery View
We can also use the the Service discovery view to check the configuration of discovered services.