If you are using Jira for managing your backlog and tracking bugs then a Jira Dashboards is a must-have. Dashboards provide an excellent way to quickly track progress and easily gain valuable insights into the progress/health of your sprint. A well-crafted dashboard will help your daily scrum or other sprint ceremony meetings, to stay focused and help ensure meetings are run efficiently and effectively. Maybe even give you back some minutes in your day.
Dashboards Gadgets
Each dashboard can contain multiple gadgets for displaying information contained in Jira. There is a range of different gadgets available pre-installed with additional gadgets that can be added. Some of the most useful gadgets I use are the pie chart and filtered results.
- Filtered Result – Displays the results of an issue filter driven by a search query and allows you quickly see results of important queries. So you can create any search query and have those results rendered in your dashboard.
- Pie Chart – Displays issues from a project or issue filter, grouped by a statistic type, in pie-chart format. Issues can be grouped by any statistic type (e.g. Status, Priority, Assignee, etc).

Useful data to display on your dashboard.
The following information I find extremely useful to help bring focus to our scrum of scrum meetings and daily scrum with the wider team.
All Blocked Items – this is a filtered result displaying all blocked bugs or stories in the current sprint. One of the goals of a scrum is to identify any potential blockers and attempt to unblock them to ensure the team is not impeded from progressing through their items. So this is a great list to review at the start of each scrum. Display fields could include: Epic, Ref, Summary, Assignee, Status, Progress, and Priority. Filtered query example:
project = {your project} AND type in (Bug, Story) AND status in ("Dev Blocked", "QA Blocked", "UAT Blocked") AND Sprint in ({your sprint}) ORDER BY priority DESC, status ASC, created DESCAll Recently Created Bugs – a filtered result displaying all new bugs created in a specified number of days. Display fields could include: Epic, Ref, Summary, Assignee, Status, Progress, and Priority. This can be reviewed daily to ensure new bugs are being correctly allocated and to monitor the volume of bugs being created daily. Filtered query example:
project = {YOUR PROJECT} AND type = Bug AND Sprint in ({your sprint}) AND created > startOfDay(-1) AND created < endOfDay() ORDER BY created DESC, priority DESC, status ASCAll Recently Add Stories – a filtered result displaying all newly created or added stories to the sprint. Display fields could include: Epic, Ref, Summary, Assignee, Status, Progress, and Priority. Filtered query example:
project = {YOUR PROJECT} AND type = Story AND Sprint in ({your sprint}) AND created > startOfDay(-1) AND created < endOfDay() ORDER BY created DESC, priority DESC, status ASC
All Items in Development or Ready – a filtered result displaying all items (bugs and stories) that are with the development team. An item will go through several statuses (new, in progress, code review, ready for deployment, etc) while it is with the dev team and this list will include all of those. Display fields could include: Epic, Ref, Summary, Assignee, Status, Progress, and Priority. Filtered query example:
project = {your project} AND type in (Bug, Story) AND status in ({comma separated list of your dev statuses}) AND Sprint in ({your sprint}) ORDER BY priority DESC, status ASC, created DESCAll Items in QA or Ready – a filtered result displaying all items (bugs and stories) that are with the QA team. An item may go through several statuses while it is with the QA team and this list will include all of those. Display fields could include: Epic, Ref, Summary, Assignee, Status, Progress, and Priority.
project = {your project} AND type in (Bug, Story) AND status in ({comma separated list of your QA statuses}) AND Sprint in ({your sprint}) ORDER BY priority DESC, status ASC, created DESC
All Items in UAT or Ready – a filtered result displaying all items (bugs and stories) that are with the UAT team. An item may go through several statuses while it is with the UAT team and this list will include all of those. Display fields could include: Epic, Ref, Summary, Assignee, Status, Progress, and Priority.
project = {your project} AND type in (Bug, Story) AND status in ({comma separated list of your UAT statuses}) AND Sprint in ({your sprint}) ORDER BY priority DESC, status ASC, created DESC
All Items Ready to be shipped – a filtered result displaying all items (bugs and stories) that have been through UAT and are ready to be shipped to Production. Display fields could include: Epic, Ref, Summary, Assignee, Status, Progress, and Priority.
project = {your project} AND type in (Bug, Story) AND status in ({your ready for production status}) AND Sprint in ({your sprint}) ORDER BY priority DESC, status ASC, created DESC
All Items By Status – a pie chart displaying all Items grouped by Status. This is useful as you move through the scrum to see items progress through the various status and you can easily click on any status to see all the items in a particular status. This is based on a query of all items in the current sprint.
All Items by Assignee – a pie chart displaying all items in sprint grouped by the Assignee. This is handy for each individual as they can quickly click on their name and get a list of all items assigned to them in the sprint. It is also useful to quickly identify any potential bottlenecks. While we do try to allocate stories based on capacity at the beginning of each sprint things happen and inevitably we occasionally lose the balance. This visual representation helps keep a check on that. This is based on a query of all items in the current sprint.
All Items by Epic – a pie chart displaying all items in Sprint grouped by epic. This visual is useful for quickly identifying where the lion’s share of the works falls in a sprint and which Epics might be at risk of not being completed as you move through the sprint. This is based on a query of all items in the current sprint.
Note: Make sure you share the queries with the group that will be accessing the dashboard otherwise the gadget will not be able to retrieve the results. Also while it is possible to use a dynamic value for the current sprint you might get mixed results. Rather you might want to have a current sprint dashboard and a previous sprint dashboard and appropriate queries for both.
Other useful gadgets
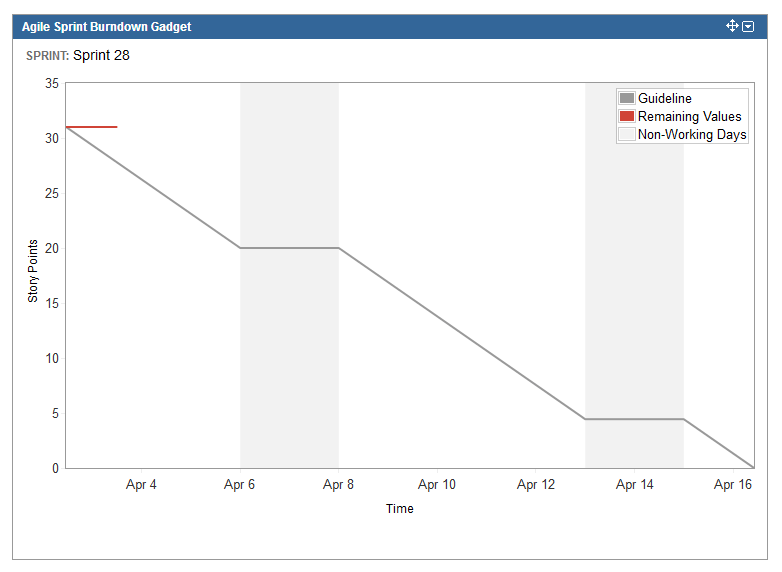
Sprint Burndown – the sprint burndown gadget to track remaining work. This is a useful chart for a quick visual to see if you are on track.
Created vs Resolved – displays a chart of the issues created vs resolved over a given period. If more issues are being created than are being resolved over a given period the chart will display the area between the two lines as red. If more are being resolved then the area will be green.
Sprint Health – provides a visual snapshot of the health of a sprint.
