How to Annotate with OBS

In a previous post I gave a quick introduction to OBS, if you are not familiar with OBS, I highly recommend checking it out. In this post, I’ll show you how you can easily annotate while recording or streaming with OBS.

Often while presenting we will use a pointer to bring attention to an area on a slide or a smart board/whiteboard to help illustrate a concept or idea and further engage our audience. In my quest to provide the same experience while using OBS for recorded and streaming demos I discovered there are several tools available that enable you to write and draw on your display capture device.

Continue reading

Getting started with OBS

Earlier this year I took part in a Social Impact Hackathon organized by Valtech, CreateLabs, Contentful for the Henry Street Settlement in NYC. During the event I introduced OBS (Open Broadcaster Software) and shared some handy tips on how to get started using this awesome tool to improve your video content and/or presentations and client demos. I’ll share some of those tips over a series of posts starting with a quick intro.

What is OBS?

OBS is an open source video production and streaming application with a large community of developers. It can help you produce better quality recorded video and/streaming video content.

How could you benefit from using OBS? During the pandemic just about everyone has become familiar with video steaming services. Social distancing and lockdowns caused an unprecedented number of people to working or studying from home making services like zoom a household name in 2020.

This increased popularity of streaming video pointed out noticeable differences in quality. With the more professional-looking, having multiple camera angles, titling, effective lighting and crisp audio, VS other video streams consisting of one or more talking heads and poor audio. What’s the difference? Well it’s not exactly difficult to record and share a video of yourself these days. Most people can do it directly from their phone or laptop webcam. However, to produce professional looking recording requires a bit more time, and effort and some decent software to enhance the quality of your recording. That’s where OBS comes in as it can help make improve the quality of your video recordings, and presentations in general.

On my current Sitecore project our development team have adopted OBS to create short recordings to showcase each feature they have completed in the sprint. These are attached to the user story and then used in after Sprint Demo to showcase to the BA, QA and the client what has been completed in the sprint and how the new feature functions. This has the following benefits for the entire team:

  • Developer – this acts as a confirmation check as they read through stories acceptance criteria and as part of the as part of the recording prior to demoing the feature. This helps confirm feature has indeed been implemented according the defined Acceptance Criteria and identifies any short comings or issues. Which can then be addressed. Developers gain confidence in creating recorded presentations. We’ve also found developers gain confidence and those that might be slightly introverted can significant confidence and are less intimidated presenting in front of the client. Prevents developers simply throwing features over the wire to QA without ensuring it functions as expected – not that they would.
  • BA – This helps solidify features have been implemented according the Acceptance Criteria and identify any short comings or issues.
  • QA – They can see exactly how a feature has been implemented, how to test it and where to go if they need to configure or change anything in Sitecore. Reduces the amount of communications back and forth.
  • Program Management – gain confidence in what is being delivered and the quality.
  • Client – They can see the progress without waiting for it to go through QA. Reaffirms that the feature functions and is designed as they had anticipated and provides an opportunity to provide feedback earlier in the lifecycle. Also as its recorded and attached to the user story so it can be re-visited when they start their UAT testing or if someone is unable to attend the after Sprint Demo meeting.
Continue reading

Faking it with Fiddler

So there are occasions when working with a third party services you need to be able to develop and test against various scenarios and respond differently based on the response from that service. Controlling the response can be a challenge sometimes with service being outside of your control.

Thankfully you can easily fake the response with tools like fiddler. Fiddler is an awesome tool and has been around forever and has always had a spot in my developer utility belt.

Continue reading

Sitecore Commerce Connect Getting Started

Having recently onboarded a developer onto a Sitecore project that utilizes Sitecore Commerce Connect, I thought it would be useful to share some that knowledge with the community. If you too find yourself starting a project that uses Commerce Connect, hopefully you’ll find this information helpful and allow you to hit the ground running quickly.

Sitecore Commerce Connect – What is it exactly?

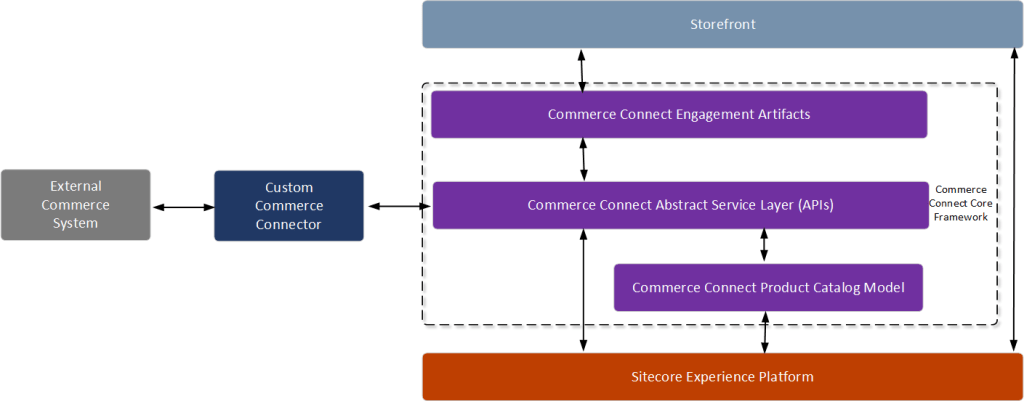
Sitecore Commerce Connect is an e-commerce framework designed to integrate Sitecore with different external commerce systems and, at the same time, incorporate customer engagement functionality provided in the Sitecore Customer Engagement Platform.

It is supposed to act as an abstraction layer between your Sitecore implementation and the External Commerce System. The Commerce Connect Core by providing services and models to help implement basic commerce features such as cart, pricing, order, customer and catalog management.

Continue reading

Remote Debugging

Sometimes you run into scenarios where you cannot reproduce a bug/issue locally and requires you to investigate the issue on actual server where your are experiencing the issue. Now as it is a higher environment you most likely don’t have the luxury or at least you shouldn’t have Visual studio running on this environment where you could easily debug.

Thankfully though with the right tools and access you can easily setup remote debugging and step through the code as if it were running on your local environment and hopefully shine some a light on the problem.

Continue reading

Instrument Sitecore SQL Container for Prometheus

In the previous post in this series on monitoring Sitecore containers I showed you how to instrument your Solr container, in this post, I’ll show you how to instrument the Sitecore SQL container and expose metrics for Prometheus to scrape.

SQL Exporters

There are several SQL exporters available in the Prometheus community some of these are SQL agnostic. Those that support MSSQL, either obtain their metrics via performance counters or by querying SQL directly. I recommend you review the different exporters and then choose an exporter that meets your specific requirements or you create your own custom exporter.

Lets take a look some of these exporters and see if they would be a good fit for exporting metrics from Sitecore SQL container.

Continue reading

Prometheus File Based Service Discovery

One of the challenges with having a pull model like Prometheus is that it needs to know where the targets are located so it can scrape the metrics. While we can configure static scrape targets in the Prometheus configuration file directly for our local environment I discovered anytime I want to make changes to these setting or add a new target I must restart Prometheus. This can be very annoying, as compared to my Sitecore containers, the Prometheus container takes much longer to stop and restart. So I needed to find a better solution for configuring these targets locally.

Service Discovery

Service Discovery helps solve the problem of identifying scrape targets which is really useful in an orchestrated environment as it will dynamically discover targets. There is support for several common services like:

There are several other methods of Service Discovery supported by Prometheus:

Continue reading

Sitecore Personalization Rules Vs Caching

I recently ran into an issue with a personalization rule on a rendering that changed the data source for mobile devices, a common scenario if you want to reduce payload and improve mobile experience. However, I discovered if I hit a page with the component on a mobile device I was seeing the desktop version.

Using my SPE script to list component cache settings I discovered the component had “Vary By Data” enabled – could this be the problem? As it turns out it it was. You see Personalization rules enable dynamically changing of components and their data sources. However the “Vary By Data” option causes Sitecore to render cached html markup for the component without performing an actual rendering process. For the majority of scenarios applying personalization rules before retrieving output from cache would make caching almost pointless. But there are certain scenarios, like the one I described above, where this might be beneficial and improve performance. Thankfully, there is a solution using a custom “Vary By Personalized Data” covered here by Ahmed Okour.

It does feel like a gap in Sitecore’s implementation so you either Cache a component or you Personalize it. So this needs to be captured when defining requirements.

Is this component going to be personalized?

  • No – implement caching.
  • Yes – don’t implement caching.
  • Not sure – implement caching and disable it when the component needs to be personalized.
  • Need both – customize with Vary By Personalized Data.

Useful Info

Reset Sitecore Publish Service tables

We ran into an issue with the Sitecore publishing service whereby the following exceptions were being logged:

[Information] Executing Cleanup Task : "PublishOperationCleanupTask-60832bb9509e4a37855285a8346a6a53"

[Error] There was an error adding 1 publisher operations. - Error : "Execution Timeout Expired. The timeout period elapsed prior to completion of the operation or the server is not responding." 

Following some investigation we discovered this was caused by the PublishOperationCleanUpTask running on the PublishService.

The PublishOperationCleanupTask works like the following:

  1. The “Publishing_TargetSyncState” table contains entries containing a publishing target, language, and timestamp
  2. These entries are updated when one of the following publishes is done:
    a. Incremental publish
    b. Publishing the root “sitecore” item with subitems
  3. The PublishOperationCleanupTask checks the entries in the “Publishing_PublisherOperation” table, and removes entries that are older than the timestamp in the “Publishing_TargetSyncState” specific to the language.
  4. This task runs by default once a day but can be configured to run as frequently as required.

So this job is suppose to cleanup Publishing_PublisherOperation table, however on inspection of this table we discovered it contained much older records that had not yet been removed. Indicating the job was having problems completing its task or at least it was not able to cleanout the records.

Part of the solution to resolve the Timeout Expired exception was to increase the <CommandTimeout> setting located in the sc.publishing.sqlazure.xml file. The default value is set to 120.

But what if you wanted to just cleanup the publishing service tables? The following tables are created in the Sitecore master database when you install and setup the publishing service:

  • Publishing_ActivationLock
  • Publishing_Data_Params_FieldIds
  • Publishing_Data_Params_Languages
  • Publishing_JobManifest
  • Publishing_JobMetadata
  • Publishing_JobQueue
  • Publishing_ManifestOperationResult
  • Publishing_ManifestStatus
  • Publishing_PublisherOperation
  • Publishing_TargetSyncState

To reset these tables you can run the following command from the Publish Service webroot: Sitecore.Framework.Publishing.Host schema reset –force

NOTE: The only risk in running this would be if you have any publishing jobs that are in-flight will need to be republished.

Useful Links

Happy Publishing!

Instrument Sitecore Solr Container for Prometheus

So far in this series I have provided a brief introduction to Prometheus and shown you how you can configure Prometheus to monitor Docker and the HostOS metrics and visualize performance metrics using Grafana. In this post I’ll show how to instrument the Sitecore Solr Container to expose performance metrics for Prometheus to scrape display those metrics in Grafana. I’ll go into a bit more detail on Solr metrics, than what I shared during my Sitecore Symposum presentation: Insufficient facts always invite danger, Captain!, which is still available on demand.

Continue reading